Relatively Momentous?
Perspectives, by Mark Robertson, Managing Partner January 24th, 2025
Based on the track record of Seeking Alpha’s Top Ten for the last five years and its emphasis on momentum, we’ve added Relative Momentum to the screening characteristics available at Manifest Investing. (Psssst. You’ll be looking at my first shopping list for my Groundhog entries)

Based on the results explored here, Manifest Investing has added a Relative Momentum indicator or characteristic to company reports and screening criteria. The thinking is that this may be more applicable to undervalued — or possibly non-core portfolios — that have shorter (1-year) time horizons. But there’s also a potential for “best of both worlds” flagging candidates with solid long-term forecasts and excellent quality that exhibit oversold or persistent momentum-based entry points. This is something of a “beta” and observations may lead to adjustments. Or it may become dust in the wind. Let’s see where it takes us.
If Seeking Alpha’s Steven Cress had entered the Groundhog Challenge over the last two years, he’d likely be a 2-time defending champion. Yes, he’d be “keeping up” with Jim Gallagher. Seeking Alpha has published an annual Top Ten group for several years. Cress seems to be directly responsible for the last two years and his contribution is unclear prior to that.
These Top Ten lists have beaten the market for the last five years with returns exceeding 100% for 2023 and 2024. Keep in mind that the seemingly lower 2022 result was versus a -20% market.
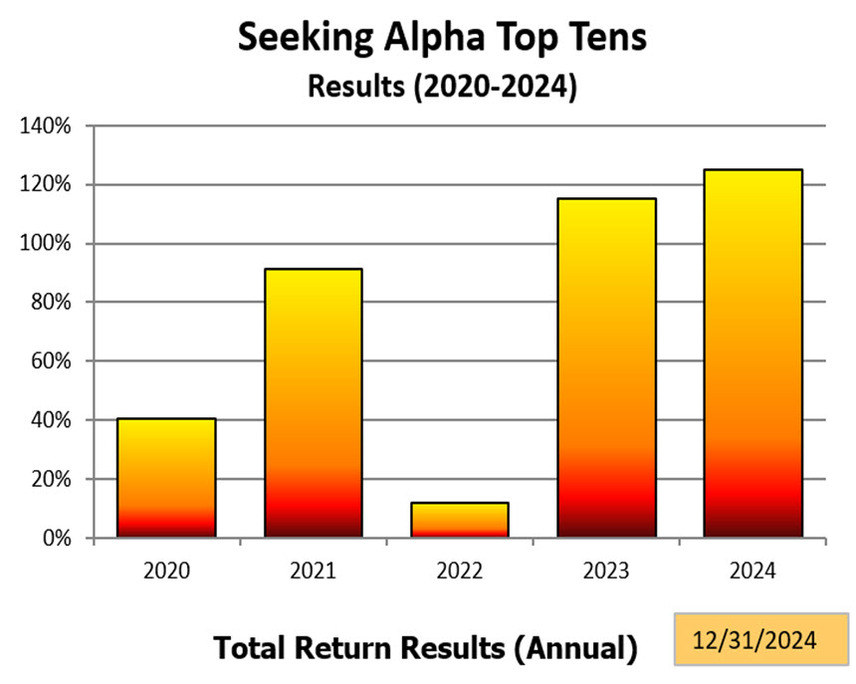
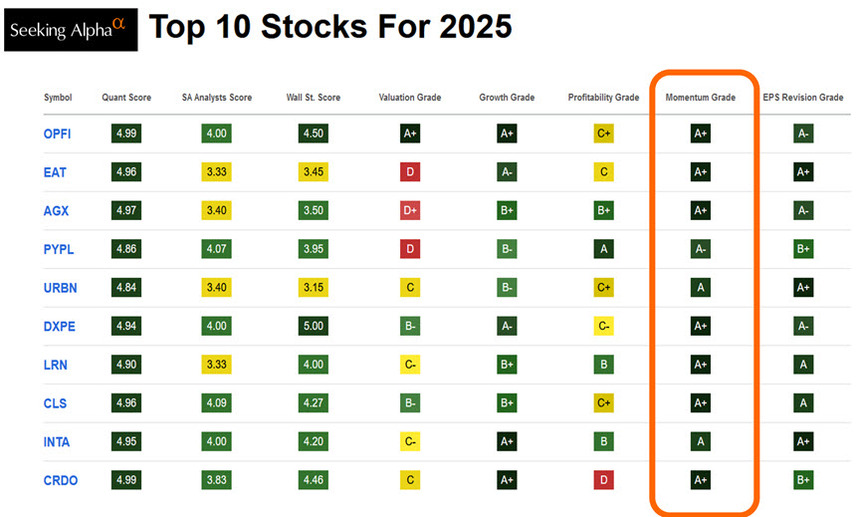
The Momentum grade on display here at Seeking Alpha seems to highly correlate with rankings of trailing 52-week total return performance.
Comprehending, Defining & Deploying Momentum
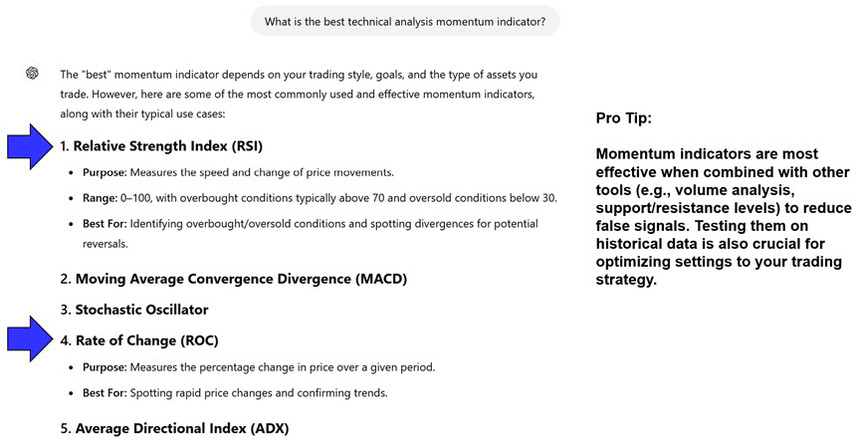
Momentrum indicators are technical analysis tools used to determine the strength or weakness of a stock’s price trend. Momentum measures the rate of the rise or fall of stock prices. (Investopedia)
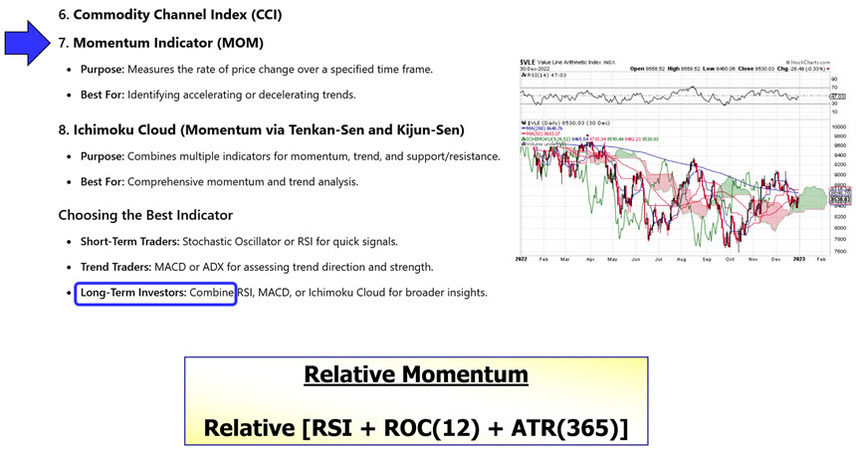
Relative Momentum
Based on this smorgasbord of indicators and characteristics, we settled on a combination of relative strength index (RSI) to flag oversold and overbought conditions, in combination with short term price momentum — Rate of Change, and a percentile ranking of the trailing 52-week total return performance.
The range is 0-to-100, a percentile ranking, with 100 suggesting “highest momentum” and 0, the opposite end of the scale, probably suggesting potentially “topped out” (overbought) with short-term and long-term price trends plateauing or decreasing.
These three components were equally-weighted and ranked to deliver a Relative Momentum index that enables us to “scan the field”.
Relative Momentum has been added to the company report pages.

Relative Momentum is also available as a screening criterion.
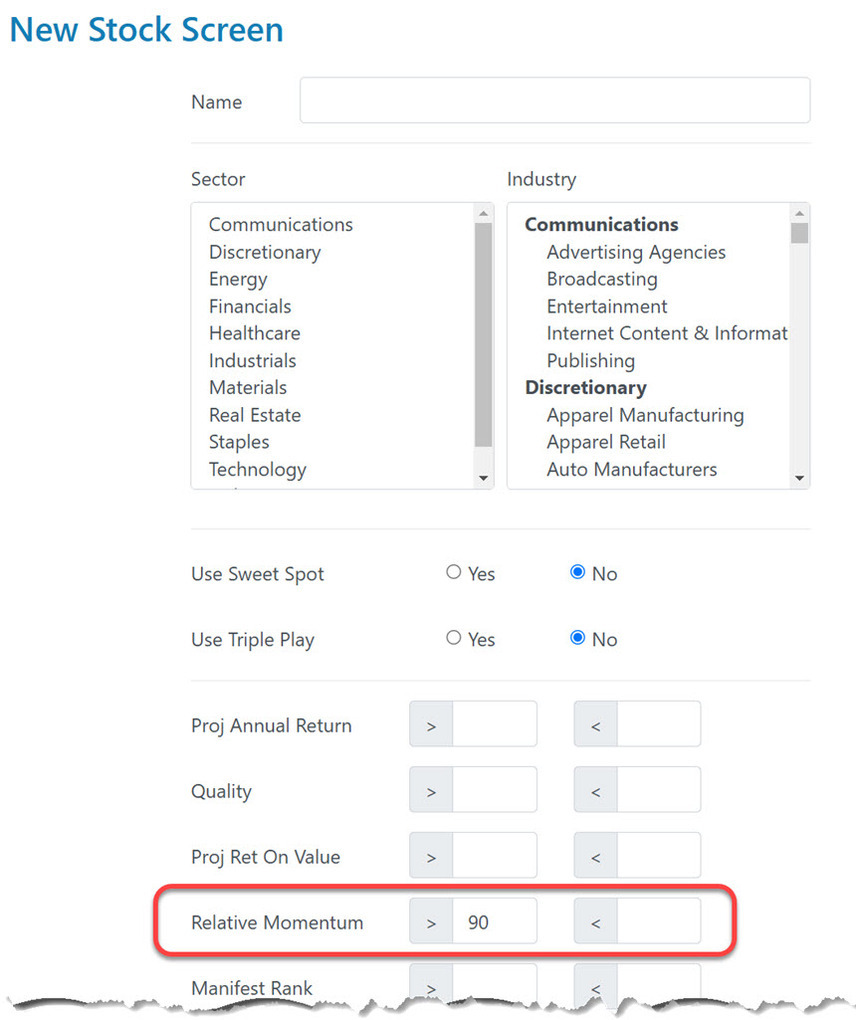
And here’s a quick look at Companies with a Manifest Rank (highest quality and superior return forecasts) in COMBINATION with the highest relative momentum characteristics:
![]()
We’ll be watching the volatility of this indicator as well as forming judgments about the utility … and hoping to capture some incremental lightning in a bottle.
Yes, Virginia, the Steven Cress selections for 2025 will be entered in Groundhog Challenge XIX. See: https://www.manifestinvesting.com/dashboards/public/seekingalpha-gh2025
About Steven Cress, Seeking Alpha
Steven Cress is VP of Quantitative Strategy and Market Data at Seeking Alpha. Steve is also the creator of the platform’s quantitative stock rating system and many of the analytical tools on Seeking Alpha. His contributions form the cornerstone of the Seeking Alpha Quant Rating system, designed to interpret data for investors and offer insights on investment directions, thereby saving valuable time for users. He is also the Founder and Co-Manager of Alpha Picks, a systematic stock recommendation tool designed to help long-term investors create a best-in-class portfolio.
Steve is passionate and dedicated to removing emotional biases from investment decisions. Utilizing a data-driven approach, he leverages sophisticated algorithms and technologies to simplify complex, laborious investment research, creating an easy-to-follow, daily updated grading system for stock trading recommendations.
Steve was previously the Founder and CEO of CressCap Investment Research until its acquisition by Seeking Alpha in 2018 for its unparalleled quant analysis and market data capabilities. Prior to that, he had also founded the quant hedge fund Cress Capital Management, after spending most of his career running a proprietary trading desk at Morgan Stanley and leading international business development at Northern Trust.
With over 30 years of experience in equity research, quantitative strategies, and portfolio management, Steve is well-positioned to speak on a wide range of investment topics.

Mark Robertson
Mark Robertson is founder and managing partner of Manifest Investing, a source for research and portfolio management focusing on strategic long term investors.