Gentex (GNTX)
Solomon's Select, by Mark Robertson, Managing Partner March 1st, 2024
You’ll find Gentex (GNTX) in any number of portfolios from Tin Cup to Buttonwood to a multi-time selection for the Round Table. We encourage an appropriate balance of focus on the rear view mirror while using your brights for the windshield view.
Solomon Select

Gentex (GNTX) is the 29th most widely-followed company by Manifest Investing subscribers. You will also find GNTX among the holdings of Tin Cup, our Round Table and the Bull Sessions Buttonwood portfolio.
Gentex was founded in 1974 to produce smoke-detection equipment. The company sold its first glare-control interior mirror in 1982 and its first model using electrochromic technology in 1987. Automotive revenue is about 98% of total revenue. The company is constantly developing new applications for the technology to remain on top. Sales in 2022 totaled about $1.9 billion with 44.2 million mirrors shipped. The unit mix breaks out as 65% interior and 35% exterior, versus about 32% exterior in 2020. The company is based in Zeeland, Michigan.
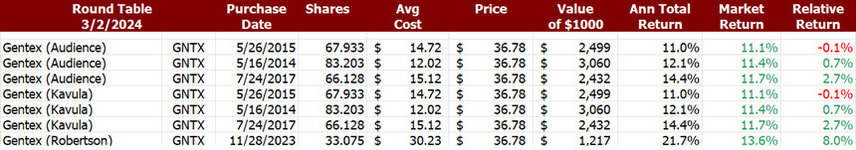
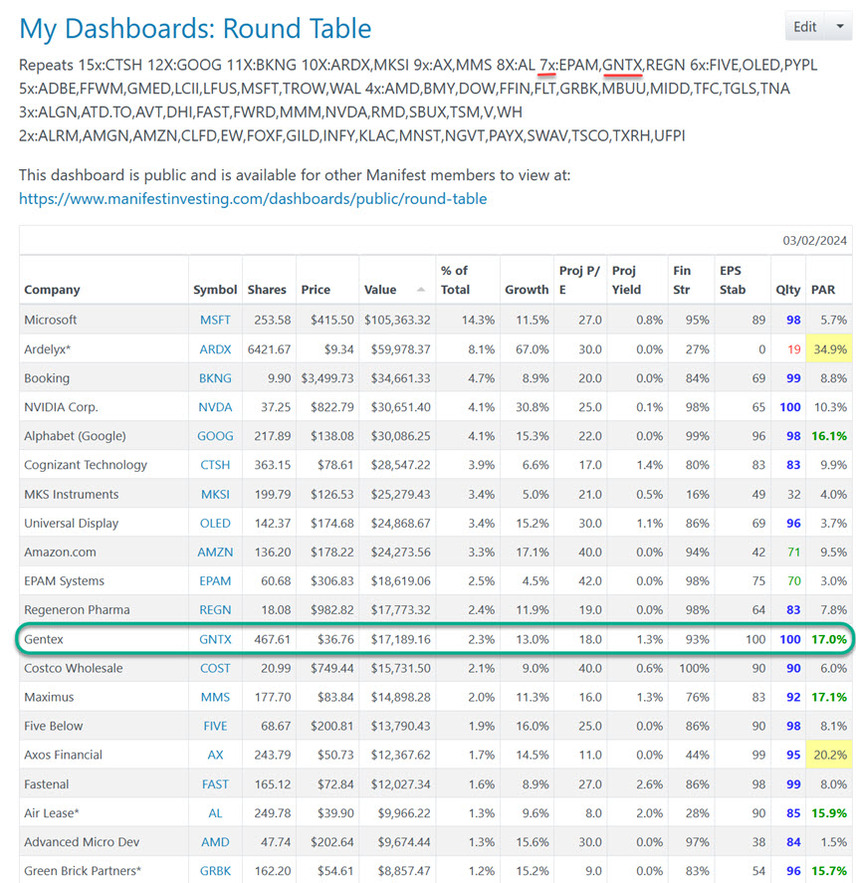
Gentex: A 7-Time Round Table Selection. We invest $1000 each time these decisions are made. So $7000 invested in Gentex dating back to 2014 … is now worth $17,199.
Equity Analysis (GNTX)
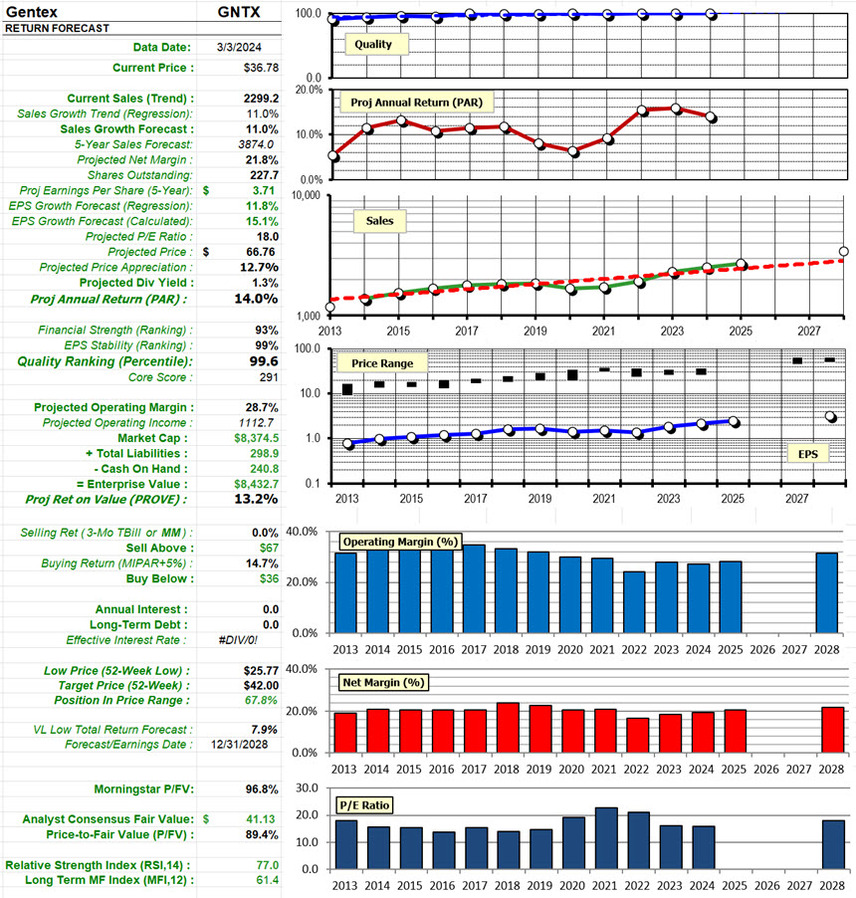
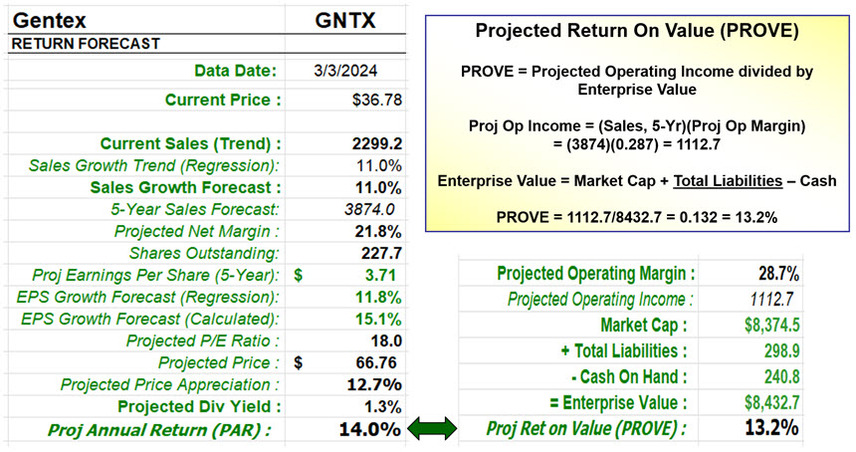
The bottom line is that the current price combines with strong fundamentals to generate an projected rate of return of 14.0%. The quality trend is unrivaled — but this is partially by classification. Gentex is a technology company but is associated with Auto Parts.
Value Line Open & Close (3/8/2024)
Gentex closed out 2023 with strong results. Fourth-quarter sales of $589 million, a record, were $40 million higher than our call and increased 19% compared to the previous-year tally. The advance was driven by a 12% rise in total auto-dimming mirror unit shipments, to 12.357 million. Demand for exterior auto-dimming mirrors from both North American and international customers was particularly robust, as volumes of these products jumped 21%. Global industry light vehicle production increased 6% in the company’s primary markets of North America, Europe, Japan, and South Korea, indicating Gentex outperformed the industry’s gain by thirteen percentage points. Margins widened during the period, supported by higher sales, price increases, and one-time cost recoveries. Purchasing cost reductions, lower inbound freight expenses, and some improvement in overtime-related costs also helped profitability. These more than offset elevated operating expenses, largely due to higher staffing and engineering related fees. All told, share earnings of $0.50 jumped 35% compared to the previous-year tally.
Shares of Gentex are ranked to outperform the broader market averages in the coming six to 12 months. Over the 3- to 5-year period, the stock, which has a Safety rank of 2 (Above Average), also offers worthwhile price appreciation potential at the recent quotation. — Iason Dalavagas (March 8, 2024)
Stock Study Highlights
We’ll take a closer look at the milestone assumptions and demonstrate the wide-ranging information on this summary.
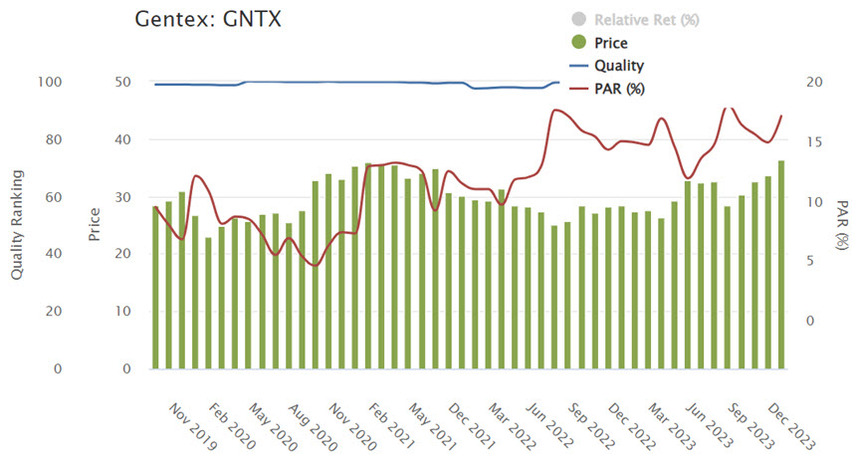
As shown in the accompanying chronicle, the return forecast (PAR) has fluctuated and is now near multi-year highs on this monthly version of the chart.
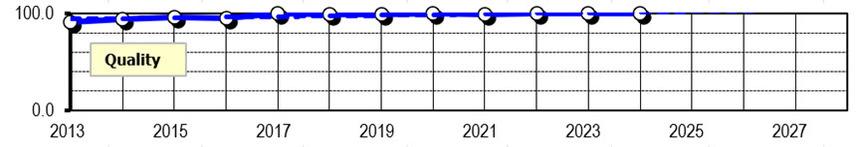
The quality ranking has been flat-lining near 100.
First, The Growth Characteristic (Top Line)
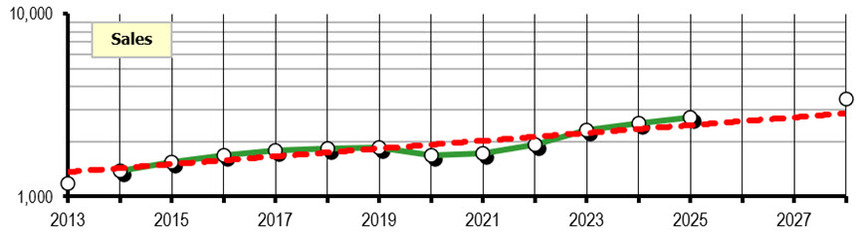
The slope of the sales trend is 11.0%. It’s clear that most of the actual/projected annual sales data land at or near the line — despite the economic sensitivity of companies in auto-related businesses.
The 3-5 year projected sales/sh growth is 10.5%. (Value Line)

We model revenue to increase about 9% on a five-year compound annual basis, up from about 8.5% previously, with low-double-digit to midteens growth in 2023 and 2024. (Morningstar)
Early in 2024 on the accompanying chart, we see that the trailing 12-month (ttm) sales is pretty much on trend. No adjustments are necessary.
With current sales of 2299.2, compounded at 11%, reaches 3874 on 3/1/2029 (5 years from now).
You can see that Value Line’s estimate for 12/31/2028 is 3400 and is a little more assertive (see slightly elevated long term sales forecast in the accompanying sales chart.) For GNTX shareholders, we hope Value Line is right.
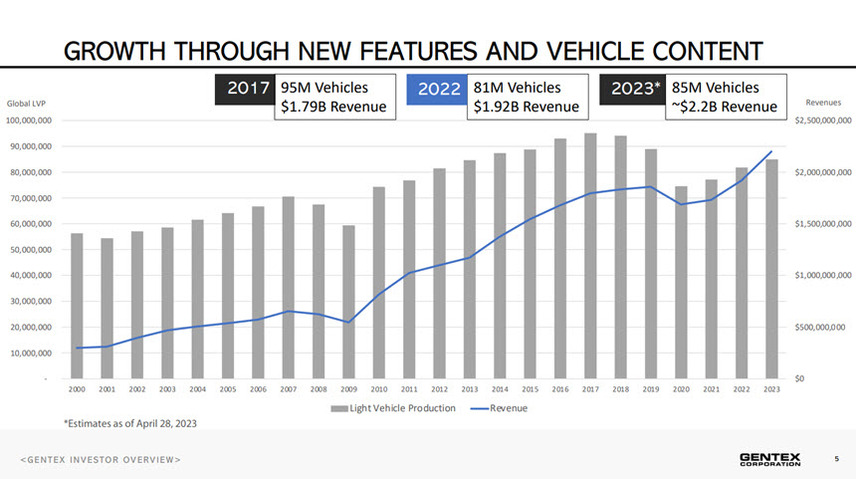
Gentex Resilience During Economic Challenges. Automotive sales fluctuate. As shown here, Gentex has maintained relatively steady growth during challenging periods. The efforts with aerospace and home security could provide more stability through future cycles. The growth rate for Gentex displayed here is approximately 10%. (2000-2023)

How did we ever back up the truck without these devices?
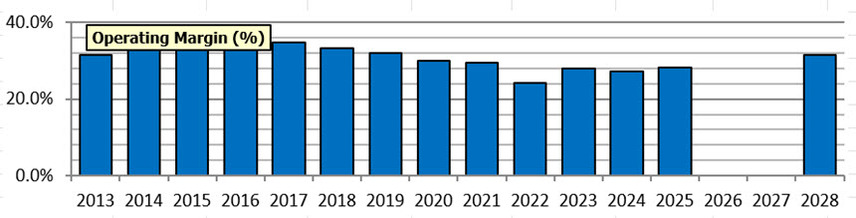
Second, The Profitability Characteristic (Net Margin)
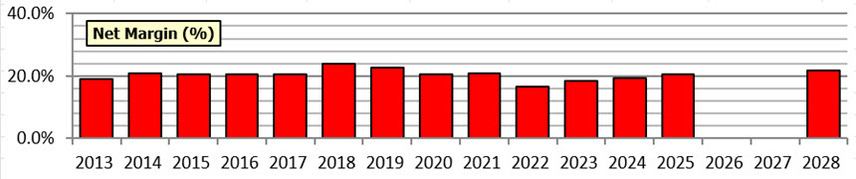
Here’s the relatively stable net margin history — considering the industries and segments that Gentex serves.

This is one of the most important characteristics to comprehend and anticipate.
Because we’ve calculated a 5-year forecast for top-line sales, that result — multiplied by the expected net margin — and divided by projected shares outstanding will yield the projected earnings per share (EPS).
The average net margin is 20.4%. (2015-2024)
“We believe additional margin expansion will remain difficult but not impossible, since automakers always seek price concessions. We model operating margin (more on this below) to average about 23.5% during our five-year explicit forecast period (about 23% in our prior valuation) and a midcycle level of about 25%. " — Morningstar
“Margins widened during 2023, supported by higher sales, price increases, and one-time cost recoveries. Purchasing cost reductions, lower inbound freight expenses, and some improvement in overtime-related costs also helped profitability.” — Value Line
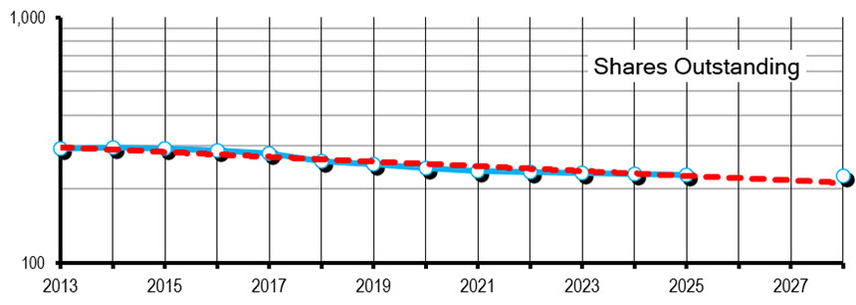
The math is the 5-year sales forecast times the projected net margin divided by shares outstanding:
5-Year EPS Estimate = (3374)(0.218)/(227700) = $3.71 (On 3/1/2029)
3-5 Year EPS Estimate (Value Line) = $3.25 (Keep in mind this is on 12/31/2028)
If it’s “my” stock study, I actually eyeball that net margin graph and I’m good with 20% projected margin. Using 20% instead of 21.8%, the 5-year EPS estimate would be $2.96.

The Relationship of Price-to-Profitability Is Next, But First A Philosophical Difference
We use the Preferred Procedure, sometimes referred to as an Expected Income Statement, or Business Model Analysis for every single company in the Manifest Investing coverage universe.
The traditional process taught by and performed during a Stock Selection Guide-based stock study is generally based on estimating a sales growth rate and also, an EPS growth rate — sometimes using nothing more than the visual analysis graph of historical earnings.
So, EPS Growth is an INPUT on these traditional studies to derive EPS.
For us, the EPS Growth is an OUTPUT of the analysis, selections and decisions made so far. You’ll find the EPS Growth displayed as two outputs:
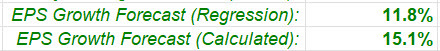
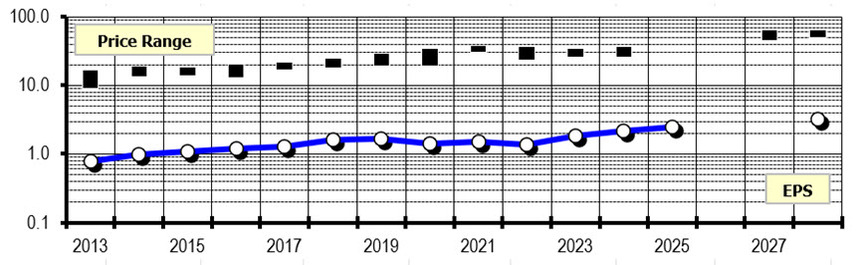
(1) The first is simply the computerized trend analysis (the slope of the series of annual results) known as a regression and based on the accompanying chart.. Excel says that this series of earnings results has an annualized growth rate of 11.8%. For most of us, this is a far better representation and characterization of growth expectations.
(2) The second is simply a 5-year compound calculation between the 5-year EPS estimate ($3.71) and the current (or TTM) EPS at $1.84 (12/31/2023). The math is (3.71/1.84)^(1/5) – 1 = 0.151 = 15.1% (n=5, number of years)
An investor could take this as a sort of “reasonable range”, for EPS Growth of 12-15%.
The EPS growth rate for the next 3-5 years is 12.5% per the Value Line Annual Rates summary.
Yes, You’re Looking At The P/E Ratio Here. The P/E ratio is a comparison of the stock price (P) and the profitability (E, for EPS). The P/E ratio is literally the relationship between two characteristics … for us to see.
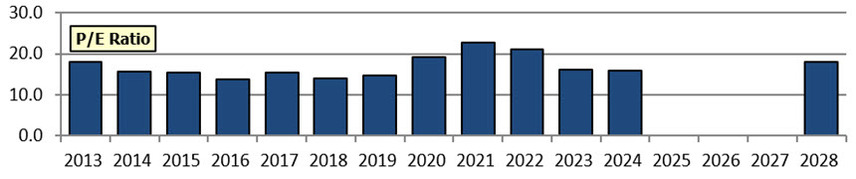
Yes, You’re Looking At The P/E Ratio Here, Too. In this case, we make the comparison by dividing the stock price by the earnings. The P/E ratio for Gentex has ranged from 13.8x to 22.7x over the last decade, an average of 16.8×. (2014-2023)
This Takes Us To The Bottom Line, Expected Return
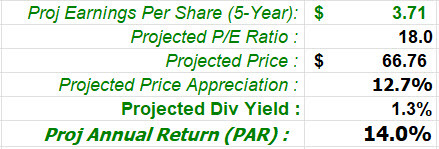
The 5-year forecast price is calculated using the EPS projection and multiplying it by an ethereal creature, the P/E Ratio.
In this case, Value Line expects the P/E to be 18.0x in five years.
The projected price is (3.71)(18.0) = $66.76
The annualized price appreciation is ((66.76)/(36.78))^(1/5) – 1 = 0.127 = 12.7%
The projected annual dividend yield is 1.3%. We add that to the annualized appreciation to get the Projected Annual Return (PAR) forecast of 14.0%.


Let’s Talk Quality … and Defining Core Holdings
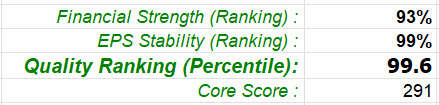
The four components of our quality ranking are: Financial Strength, EPS Stability and relative growth and relative profitability versus peers and competitors.
What makes a core holding?
- High Quality
- Sufficient Track Record
- Strong Balance Sheet
- Consistency & Predictability
- Competitive Advantage
- Solid Capital Allocation
In a word (or three), “Up, Straight and Parallel.”
We believe that the sum of Financial Strength, EPS Stability and Quality “personify” much of this sentiment. Yes, it’s a little bit of doubling down on Financial Strength and predictability — because they’re both embedded in the Quality ranking — but it seems like a prudent emphasis.
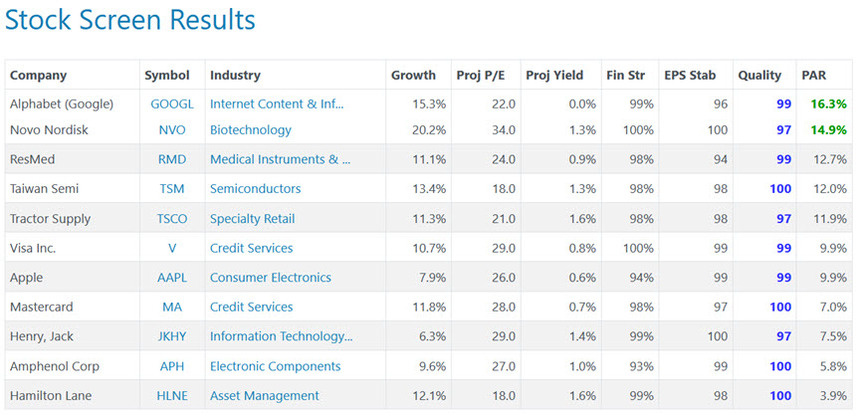
Just out of curiosity, how many companies have a Core Score greater than Gentex?
Profitability Analysis (Different Part of The “Food Chain”)
Monitoring the profitability from an operating perspective (EBIT, earnings before interest and taxes) can be advantageous for early stage companies. We focus on the continuing operations, less on accounting gymnastics and tax turbulence. We believe there are fewer variables relative to other valuation measures and it’s an effective way of thinking about any investment. This is because we’re basically thinking about the annual returns (%) for the next (10) years of operations.
Here’s the reconciliation of P/E-based analysis versus PROVE. The P/E ratio on the left can often be “adjusted” to help reconcile the return forecasts.

But Wait … There’s More!
Steak knives shown are courtesy of Williams-Sonoma.
Our target for buying a stock is generally the “average” return for all stocks (MIPAR) plus five percent. For some core companies, this margin of safety threshold might get reduced to 3% — citing that some high-quality companies have fairly “tight” ranges for PAR over time. For others (possibly non-core) we might seek return forecasts 5-10% greater than MIPAR.
As shown here, the price to consider buying GNTX is approximately $36.
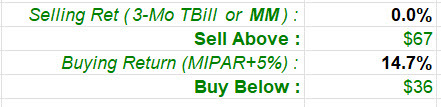
For selling, the return that we’d consider selling a core company is “money markets or less” and for very high-quality, core companies, we’ll often think of requiring that the return forecast approach 0% or even dip negative.
GNTX qualifies for this 0% condition. The price that would generate a 0% PAR under this set of fundamentals is $67. “Sell Above $67”

Remember That Banks Judge Companies …
Does anybody remember the incentives to open a banking account bank in the 1960s?
But we digress …
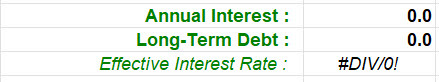
In this case, Gentex has no long term debt.
But if they needed capital, banking underwriters and analysts would determine the interest rate. That’s right. You don’t need to scratch your head over interest coverage, or a seemingly infinite cadre of ratios that can defy context or whether your study company will pay back the bank.
What if I told you that all of this research has been done and the result is basically available in a single number — WITH CONTEXT?
The single number is the effective tax rate, the annual interest payment divided by the “mortgage balance.”
If the number is 2%, the bankers WANT to give more money to the company and they can do so while continuing to sleep at night.
If the number is 8%, you might hear that 4-letter word (junk) muttered and your bank officers are not 100% confident about repayment. But we generalize …
The average Effective Interest Rate is 4.68%.
Texas Instruments (TXN) has a A++ financial strength and effective interest rate of 1.96%. Novo Nordisk (NVO) A++ and 1.77%.
Wynn (WYNN) C+ and 5.95%. American Axle (AXL) C+ and 7.06%.
It’s just one component of our financial strength review. We also assess (rank) debt levels versus enterprise value.

The Rhinos Weigh In …
We track the opinion of a variety of analysts. They can vary widely.
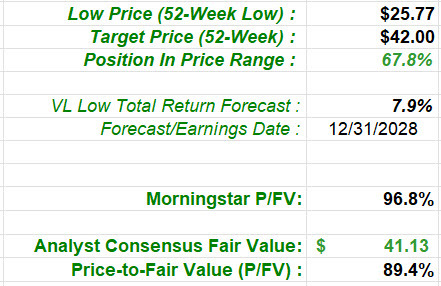
As shown in the accompanying image, the Rhinos actually set a window from the recent low price to a target high price over the next year. (This is often adjusted)
In the case of Gentex, we’re (somewhat painfully) reminded that GNTX could have been bought for $25.77 within the last year. Ideally, we’d like to buy within 20% of the 52-week low price. This is a Hugh McManus (Irish Spring) screening parameter and we make it available in the Stock Screen.
Gentex is now 67.8% off the low.
The Value Line Low Total Return Forecast is a favorite. It’s generally more reliable for established, mature companies, with an established track record. We’ve also observed that actual forecast results have landed closer to the Value Line Low Forecast more often — at least anecdotally. In any event, it’s generally going to suggest a more conservative outlook that should at least be factored into the overall study. Note that we adjust “n” based on the forecast date and current price — so this Value Line forecast is “current.”
The current VL Low Total Return Forecast for Gentex is 7.9% — suggesting a “relatively strong hold.”
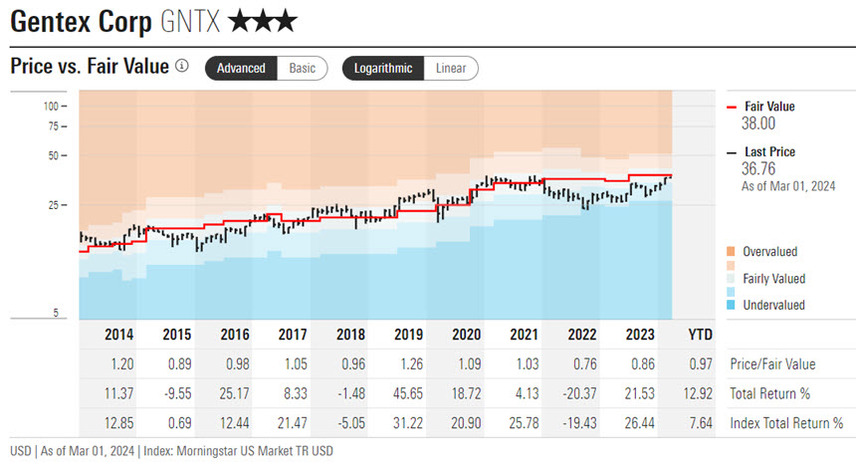
The 89.4% price-to-fair value via the analyst consensus suggests a “Good”, not “Great” current stock price and long term forecast.
Some Charting … In Search of Entry Points and Perhaps Some Alarm Settings?
The first chart is the answer to “What has Gentex done for us lately?”
And the answer is a lot. The stock price has been advancing steadily from that $26 low within the last year.
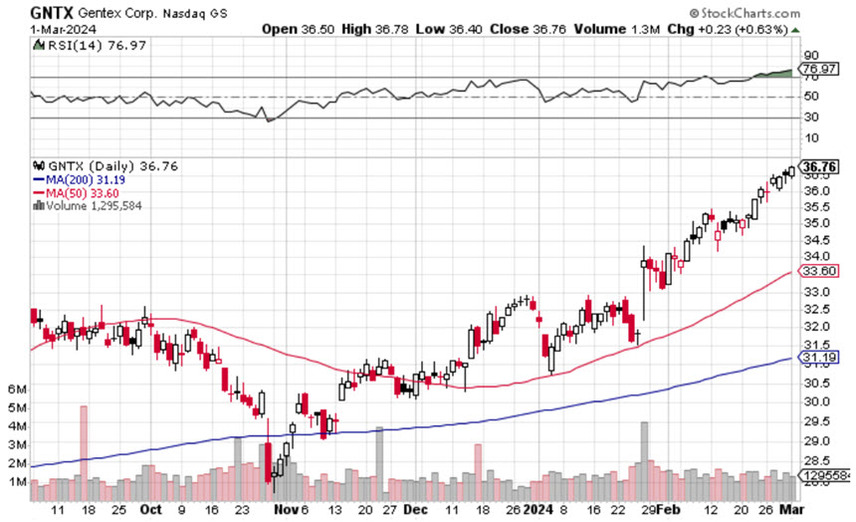
Commonly-Used ST “Trading” Chart. Displaying 6 months with a 14-day look back on the Relative Strength Index (RSI). We’d prefer to buy at a RSI<30. The sell “nudge” comes at RSI>70.
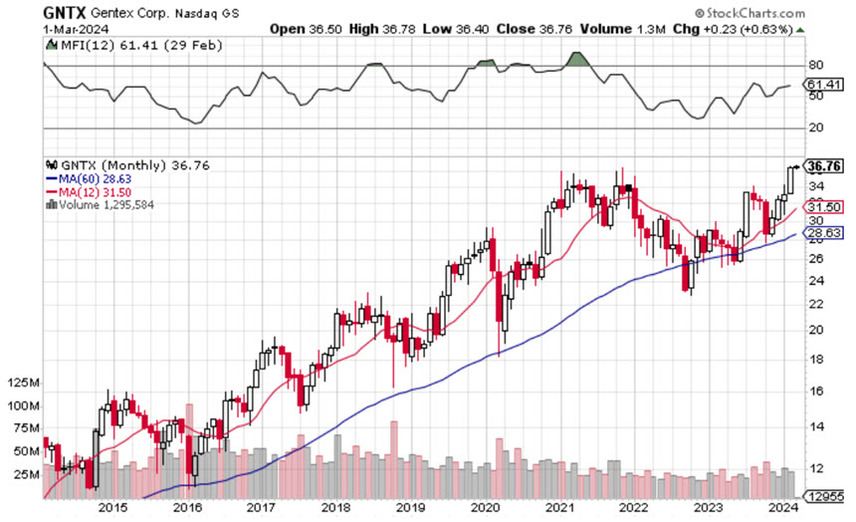
Longer-Term “Investing” Chart. This is a very custom chart that is faithful to the 10-year embedded technical analysis in an SSG visual analysis. The stock price for the trailing ten years is shown along with 12-month and 5-year trailing averages. We’re developing an affinity for the suggestion from Len Douglass that we consider the volume-driven Money Flow Index. The buy trigger is at MFI<20 and the “consider selling alert” is MFI>80.

Mark Robertson
Mark Robertson is founder and managing partner of Manifest Investing, a source for research and portfolio management focusing on strategic long term investors.