Boston Beer (SAM)
Solomon's Select, by Mark Robertson, Managing Partner August 7th, 2021
Raise a glass! Is the current price plummet in Boston Beer (SAM) a buying opportunity?

Boston Beer (SAM) is a leader in U.S. high-end malt beverages and adjacent categories, with strong positions in craft beer, hard cider, and hard seltzer. The firm sells an array of flavor variants and package sizes, predominantly centered around four priority brands: Samuel Adams, Angry Orchard, Twisted Tea, and Truly Hard Seltzer—its biggest growth engine. Its drinks are produced in both company-owned breweries as well as through third-party contract arrangements, and while the company primarily goes to market through independent wholesalers (as mandated by law), it operates a fairly large sales force to induce demand across the value chain (distributors, retailers, and drinkers). The preponderance of revenue is generated domestically.
When the quarterly conference call starts with one of the company’s favorite Rhinos stuttering, “Whoa. I’m not even sure where to start. But it appears you guys don’t know what you’re doing.” That’s admittedly some paraphrasing but it’s not far from the mark. If you’re trading stocks, it’d be a pretty good cue to run for the exits. And traders of little faith and short term perspective did. The stock price tanked like an empty brewery tower gone dry.
Growth, Profitability, Valuation
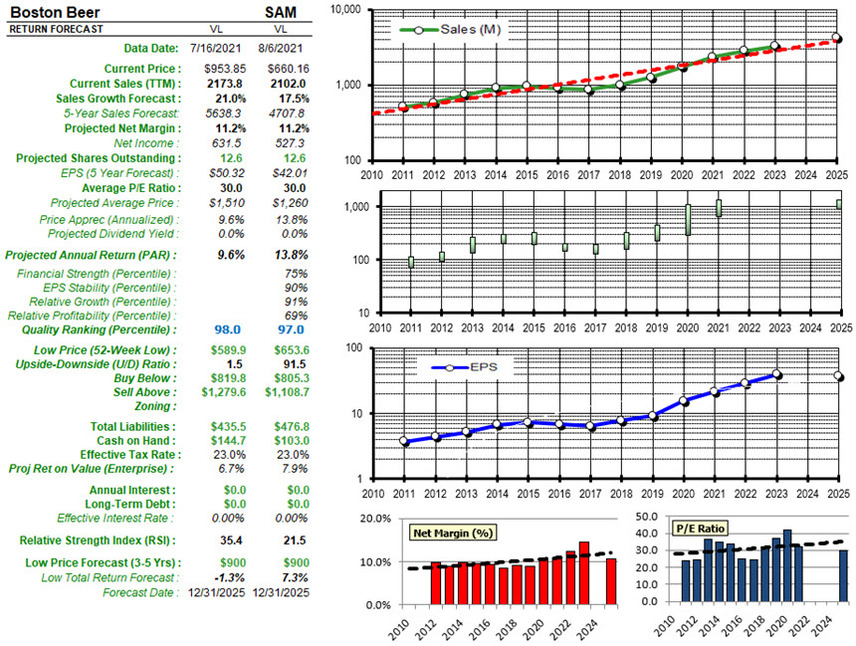
The Manifest Investing sales growth forecast for SAM is 16%. Value Line has a 3-5 year sales growth forecast of 21%.
The historical profitability for SAM for 2016-2020 has been 9.3%. Value Line is using 11.2% for the long term net margin forecast.
The average P/E for the period 2016-2020 is 32.2×. Value Line has a projected average P/E of 30×.
At the time of selection (8/6/2021), the stock price is $656.72, the projected annual return is 12-13%. The quality RANKING is 97 (Excellent) and the financial strength rating is 75 (B++).
Point of View
SAM showed up on screens as “Potentially Oversold” with a RSI of 20. We believe it is. The exits are jammed with Rhinos. They eventually remember that they’re thirsty. Long term perspective matters.
Boston Beer (SAM): Equity Analysis. Company management says that people suddenly stopped consuming the flavored seltzers and that competition has erupted making the landscape suddenly challenging. Truly this could have been communicated and mentioned prior to the quarterly financial report and dog-and-pony dance? But we’ve seen this movie before. Consumers are fickle over the short term but in the case of adult beverages — fairly reliable over the long term. This is NOT Boston Beer’s first rodeo. The chart is a great example and reminder that earnings follow sales and stock prices ultimately follow earnings. Cheers!

Mark Robertson
Mark Robertson is founder and managing partner of Manifest Investing, a source for research and portfolio management focusing on strategic long term investors.