Projected Return On Enterprise Value (PROVE)
Cover Story, by Mark Robertson, Managing Partner July 1st, 2021
Imagine a world of stock studies where you can “worry” a whole lot less about P/E ratios (and dividends) and instead focus on the business model and emphasize a few important characteristics of stewardship. Our quest to better understand the power and potential of using Projected Return on Enterprise Value (PROVE) actually began during the holiday season about a year and a half ago. After extensive consideration, we now feel that this characteristic is essential. PROVE can be used to (1) reconcile P/E forecasts and (2) we’re giving PROVE as much (or more) weight than PAR in screening, stock analysis and portfolio design and management.
“This is it — the one metric you should know about.” — Multiple Successful (Super) Investors
The Wall Street Journal once called it the “hottest metric in finance.” Warren Buffett has referred to it as the defining trait of his “ideal business.”
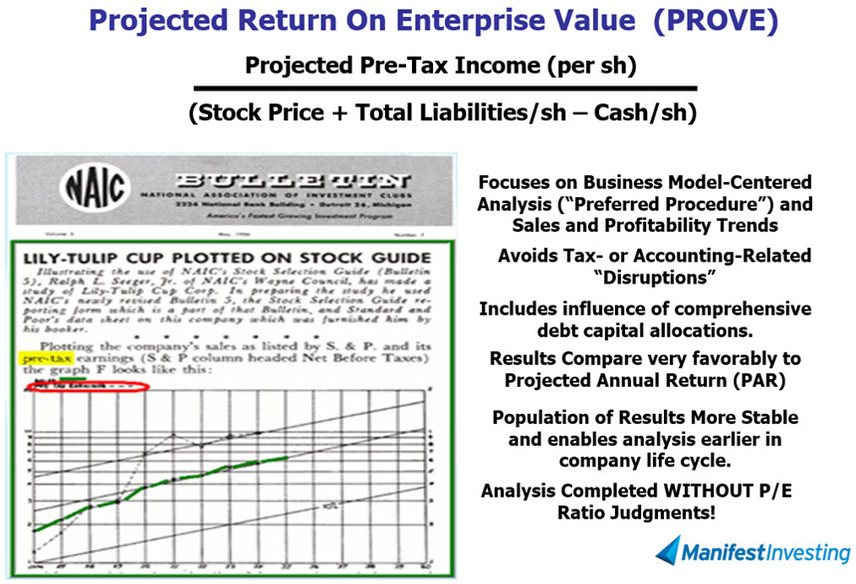
Coming Back Full Circle … Over Eight Time-Honored Decades. This set of “talking points” is relatively unchanged over the last 18 months. The original Stock Guides from the 1950s focused heavily on top line trends, pre-tax income and a better understanding of the business model. We find that PROVE likely supports a more comprehensive consideration during a study.
When Chasms Remind … and Strengthen Us
The pandemic of 2020-2021 has delivered certain reminders and certainly modified many things. We’ve been somewhat reminded of the turbulence and confusion that erupted back in 2007-2008 and the devastating (for many) challenges to effective stock studies. Much of the vulnerability centers on the mathematical characteristics of P/E ratios. In a nutshell, when economic variations drive earnings below zero, a traditional stock study basically “implodes.” When chasms materialize, the challenge of forecasting P/E ratios increases exponentially. This is also true for early stage companies.
There’s a better way.
The cornerstone of our business model-centered analysis is the top-line trend, growth rate and 5-year forecast … combined with profitability trends. (In this case, pre-tax which avoids accounting tax-related “gymnastics and engineering.”)
This is far from trivial. As Buffett has observed, “a new GAAP rule, imposed in 2018, requires a company holding equity securities to include in earnings the net change in the unrealized gains and losses of those securities [in quarterly and annual reporting]. As we stated in last year’s letter, neither Charlie Munger, my partner in managing Berkshire, nor I agree with that rule. … unrealized gains within a portfolio of stocks were never to be included in earnings and unrealized losses were to be included only if they were deemed other than temporary. Now, Berkshire must enshrine in each quarter’s bottom line – a key item of news for many investors, analysts and commentators – every up and down movement of the stocks it owns, however capricious those fluctuations may be.” This considerably compromises a stock analysis based on earnings and P/E ratios.
“While stock prices can be volatile and often deviate significantly from the underlying performance of a business over short time horizons, over the long-term, a stock’s average annualized returns tend to approach the profitability ratio of the underlying business.” — Joel Greenblatt and Charlie Munger (via Titanvest)
This was an important finding. We understand projected annual returns (PAR). We consider the PAR to be the bottom line result of any stock study. We found that PROVE resembled PAR and our research and explorations now suggest that PROVE can influence, audit and “reconcile” the selection of a projected P/E ratio during a stock study. This correlation has strengthen as the business cycle has convulsed over the last several months. PAR and PROVE strongly resemble each other.
What does Enterprise Value tell you?
Enterprise Value (EV) can be thought of like the theoretical takeover price if a company were to be bought. EV differs significantly from simple market capitalization in several ways, and many consider it to be a more accurate representation of a firm’s value. The value of a firm’s debt, for example, would need to be paid off by the buyer when taking over a company. As a result, enterprise value provides a much more accurate takeover valuation because it includes debt in its value calculation.
Why doesn’t market capitalization (current stock price) properly represent a firm’s value? It leaves a lot of important factors out, such as a company’s debt on the one hand and its cash reserves on the other. Enterprise value is basically a modification of market cap, as it incorporates debt and cash for determining a company’s valuation.

Enhancement To A Time-Honored Methodology? Probably. Modern investment club movement advocates “visualize”/calculate the future for sales (green entries/trends) and diligently track and build expectations for profits. In this case, the “flavor” is pre-tax income (magenta line) and we proceed to build a 5-year estimate (magenta circle) for these values. Dividing the projected pre-tax income (basically an average for the next decade) by the current enterprise value delivers the projected return on value.
Promising Perspectives
The method is consistent and emphasizes the preferred procedure (expected income statement approach) to stock analysis.
Accounting vulnerabilities are subdued somewhat. There’s a reason Value Line founder Arnold Bernhard focused on cash flow and P/CF for their studies. This is also responsive to the challenges cited by Buffett. And lastly, think about carry forwards and impact on early company life cycle considerations (as one example.) We believe that the analysis of promising early stage companies is more effectively supported and enabled.
The method pays much more attention to capital structure and strategy and enables a deeper understanding of debt (and cash) considerations. There’s a reason that Arnold Bernhard and George Nicholson started their books with chapters on balance sheet analysis.
PROVE is calculated without considering P/E ratios. The PROVE result can be used to audit or condition the forecast P/Es used during a stock study.
The P/E ratio will often be the biggest contributor to confusion when it comes to stock studies. The PROVE can nudge you, into “second guessing” your P/E selections (and/or profit margin expectations) — in a constructive way — to improve the results of your studies. “We are never gonna quit trying to make it better.” — Mark & Ken.

Mark Robertson
Mark Robertson is founder and managing partner of Manifest Investing, a source for research and portfolio management focusing on strategic long term investors.