Tin Cup Demonstration Portfolio (May 2021)
Model Portfolio, by Mark Robertson, Managing Partner May 1st, 2021
The million dollar milestones have started to come with almost alarming frequency. It's the type of "alarm" that is a most pleasant experience for long-term investors.
This demonstration portfolio invests the maximum allowable 401(k) in stocks. In the absence of choices within the portfolio, we shop outside the portfolio using the combination of return forecast and quality rating to identify candidates to be added to the portfolio. Total assets reached $1,000,000 in 17 years. Tin Cup has outperformed the S&P 500 since inception and the rate of return since 1995 is now 15.9% vs. 10.5% for the Wilshire 5000.
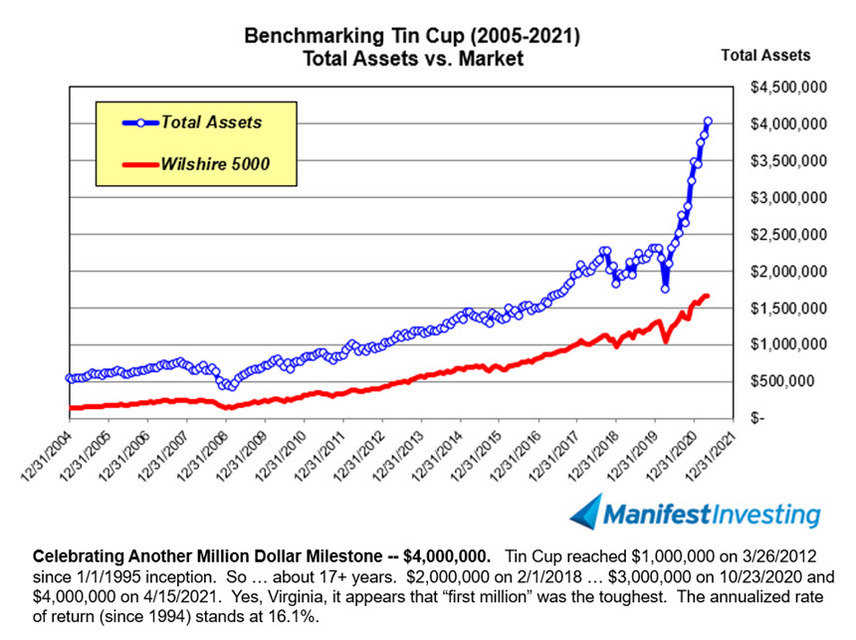
Total assets are $3,995,370 (4/30/21) and the net asset value is $814.69. The model portfolio advanced 3.65% during April 2021. The Wilshire 5000 checked in at +5.14% for the month.
Portfolio Characteristics
With MIPAR at 5.5%, our target for the minimum overall portfolio PAR is at least 10.5%. The overall portfolio PAR is 10.9% on 4/30/2021. Quality and financial strength are sufficient at the current levels of 85.4 (Excellent) and 82%. EPS Stability is 77 for the portfolio. Sales growth is in the design target range at 11.8%.
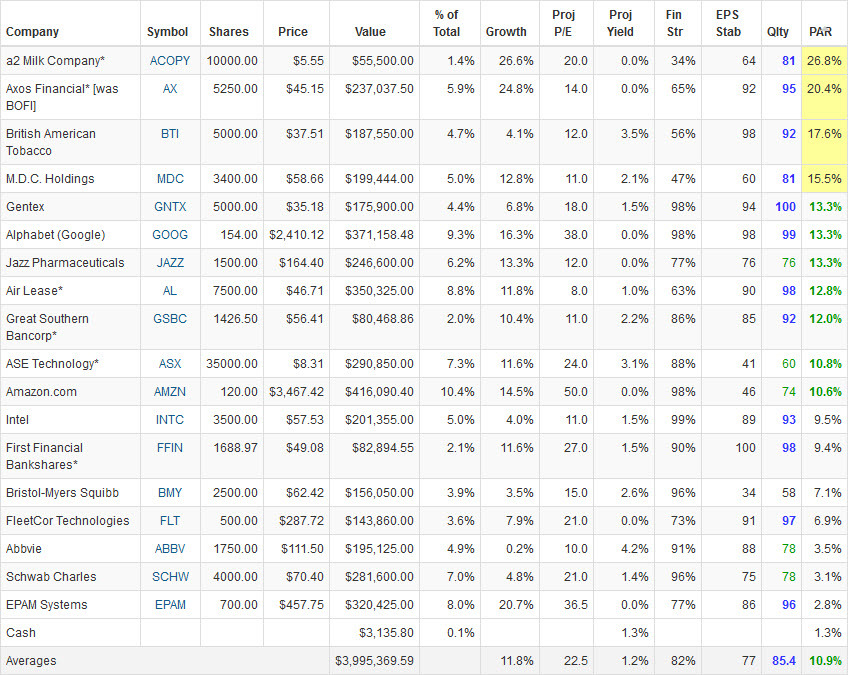
Tin Cup Dashboard: April 30, 2021. Ranked by PAR (last column on the right.) Accumulate a2 Milk (ACOPY).
Tin Cup Results (April)
OK, the accompanying graphic is from April 15th when Tin Cup finished the day above $4,000,000. The portfolio balance mightily strived to hold that level but gave way on the last day of the month (the last hour of trading) to finish just below the milestone. But it happened — and we’re celebrating.
Perhaps more interesting to note is the diminishing “time between million dollar milestones.” That first million dollar moment came during March 2012 — 17 years since inception of this qualified retirement plan demonstration. (We have invested the maximum allowable monthly amount since 1994 in common stocks.) The second million milestone arrived during February 2018 … taking a mere six years to compile the second million. The third million dollar milestone was logged during October 2020 (2 1/2 years in the making) and the next million added mere six months later during April 2021.
The day is coming when the monthly fluctuations on average will match or exceed the median value of the average American residence ($347,500 currently according to FRED).
Financial radio show host Bob Brinker speaks of the “Land of Critical Mass” and characterizes the condition as follows: A state of freedom from worry and anxiety about money due to the accumulation of assets which make it possible to live your life as you choose without working if you prefer not to work or just working because you enjoy your work but don’t need the income. Plainly stated, the Land of Critical Mass is a place in which individuals enjoy their own personal financial nirvana. Differentiation between earned income and assets is a fundamental lesson to learn when thinking in terms of critical mass. Earned income does not produce critical mass……critical mass is strictly a function of assets.
This could be a theme for July and Independence Day and could be worthy of further discussion. At what point does an investor shift into “capital preservation?” At what point and expected “balances” is the thought no longer relevant to one’s personal situation?
Dashboard Decisions
All decisions with Tin Cup are fairly mechanical, as we strive to keep the portfolio within certain limits:
(1) Overall average PAR at least 5 percentage points greater than the median return forecast (MIPAR).
(2) Excellent Quality. Overall average quality ranking greater than 80.
(3) Overall average sales growth forecast of at least 10%, but preferably 11% or more.
Conditions #2 and #3 are on target. Condition #1 — thanks to the series of transactions over the last several months has been restored to “design conditions.”
With the portfolio return forecast (PAR) in the sweet spot, there’s really not much corrective action needed at this time. We’ll accumulate more a2 Milk (ACOPY/ACOPF) from Australia/New Zealand and subject Charles Schwab (SCHW) to an audit. As noted previously, Schwab recently advanced from approximately $30 to $65 over the course of the last 10-12 months.
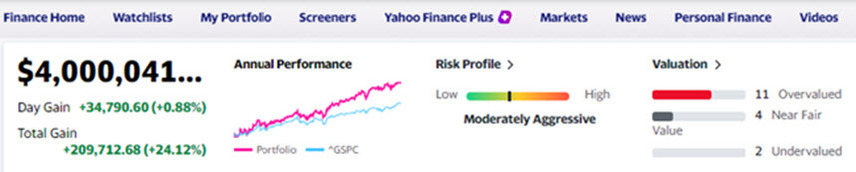
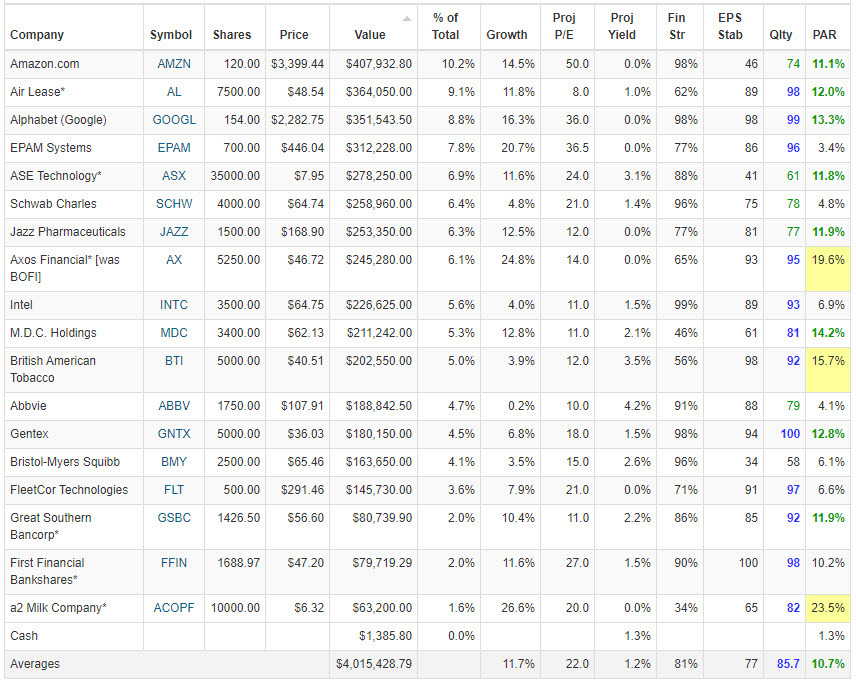
Tin Cup: Dashboard at the Milestone Moment. The top of the graphic is from Finance Yahoo and we featured some portfolio monitoring during Bull Sessions as Tin Cup approached $4,000,000. The dashboard is from the day when $4,000,000 was achieved — featuring top holding Amazon (AMZN) and a number of community favorites with a blend of relatively obscure additions, too. By the end of April, Tin Cup had paused for a breather — finishing the month at $3,995,370.

Mark Robertson
Mark Robertson is founder and managing partner of Manifest Investing, a source for research and portfolio management focusing on strategic long term investors.