Tin Cup Demonstration Portfolio (November 2019)
Model Portfolio, by Mark Robertson, Managing Partner November 1st, 2019
Tin Cup has now regained 22.4% over the trailing 10 months ... outpacing the Wilshire 5000.
This demonstration portfolio invests the maximum allowable 401(k) in stocks. In the absence of choices within the portfolio, we shop outside the portfolio using the combination of return forecast and quality rating to identify candidates to be added to the portfolio. Total assets reached $1,000,000 in 17 years and $2,000,000 in 23 years. Tin Cup has outperformed the S&P 500 since inception and the rate of return since 1995 is now 13.5% vs. 7.6% for the Wilshire 5000.
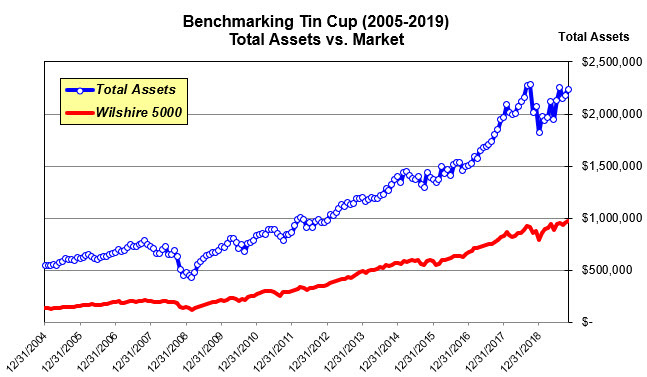
Tin Cup: Recent Performance. October 2019 continued the strong performance as net assets approached all-time highs for this demonstration portfolio.
Total assets are $2,236,607 (10/31/19). The model portfolio advanced +2.68% during October 2019. The Wilshire 5000 checked in at +2.10% for the month.
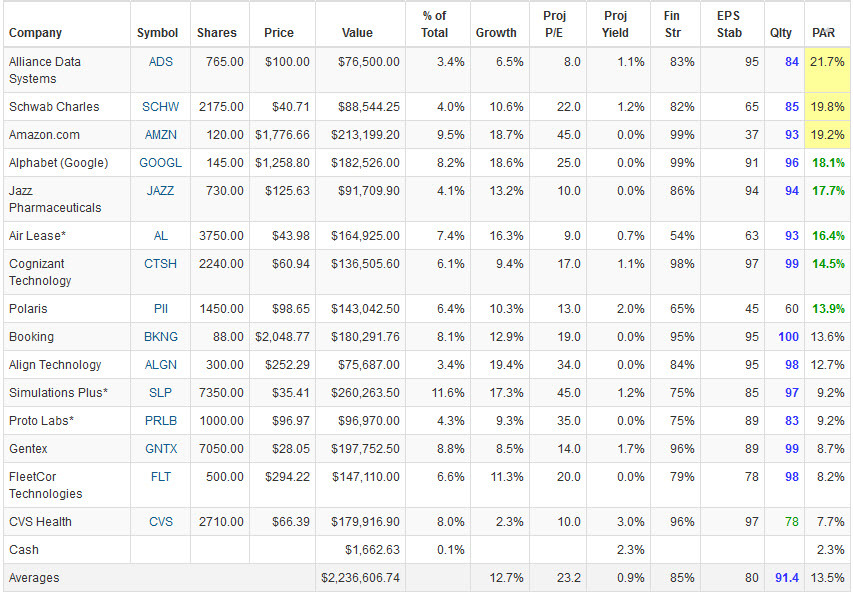
Tin Cup Dashboard: October 31, 2019. Ranked by PAR (last column on the right.) This month we accumulate Alphabet/Google (GOOGL).
Portfolio Characteristics
With MIPAR at 9.0%, our target for the minimum overall portfolio PAR is at least 14.0%. The overall portfolio PAR is 13.5% on 10/31/2019. Quality and financial strength are sufficient at the current levels of 91.4 (Excellent) and 85%. EPS Stability is 80 for the portfolio. Sales growth is in the design target range at 12.7%.
Tin Cup Results (October)
A year ago, total assets had dropped to $1,821,268 and volatility spiked upward with an intensity that can make even the most committed long term investor squeamish. As shown in the accompanying graphic of performance since 2004, the steep decline was measurably more pronounced than the speed bumps experienced with the Wilshire 5000. But with teeth fully gritted, the unit value for the Tin Cup portfolio has proceeded to advance some 22% over the last ten months — a period where the Wilshire 5000 has restored approximately 20%. Even in the darkest moments, a glimmer of outperformance. The 5-year annualized return for Tin Cup now stands at 9.7% versus 6.5% for the Value Line 1700 (Arithmetic Average) … another clear sign that the smaller companies have languished and a nudge or suggestion that our Best Small Companies may have another favorable year ahead for 2020.
Hot Seat Challenge
With the overall portfolio PAR at 13.5% when the median forecast (MIPAR) is 9.0%, there’s no “urgency” to consider selling any of the positions. The company with the lowest PAR on 10/31/2019 is CVS Health (CVS) at 7.7% — a level that is nearly equal to the “average stock.” CVS has been the subject of a number of Round Table discussions with the consensus forming that the company is engaged in a transformation that nullifies the track record and essentially renders CVS a special situation. As a non-core holding, we are more likely to sell when the PAR is less than MIPAR. (A core holding receives a selling analysis when the PAR approaches money market rates.) So … the triggers on CVS will be adjusted accordingly and will be a candidate for sale if the PAR remains below MIPAR.
Dashboard Decisions
If we “did” tax loss selling, we’d be taking a look at Alliance Data Systems (ADS) considering the decline … and the emerging outlook for the company.
With the highest PAR that resides in the sweet spot … and a position that stands at 8.1% of total assets, we accumulate more shares of technology leader Google.
The Value Line perspective: “On balance, these shares may appeal to buy-and-hold investors. To that end, [Google] offers above-average 3-5 year capital appreciation potential.”

Alphabet/Google: Business Model Visual Analysis. Google has been very consistent over the last decade and the small company growth rate persists. The milestone assumptions for the return forecast calculation displayed here were used by Ken Kavula during the October Investing Round Table. Specifically, 15% growth rate can be supported … along with steady profitability of approximately 20% net margin and a projected P/E ratio in the range of 25×. The 11-12% growth rate aligns with the Value Line Low Total Return forecast of 11.8%. We note that analyst expectations are actually slightly higher for the company.
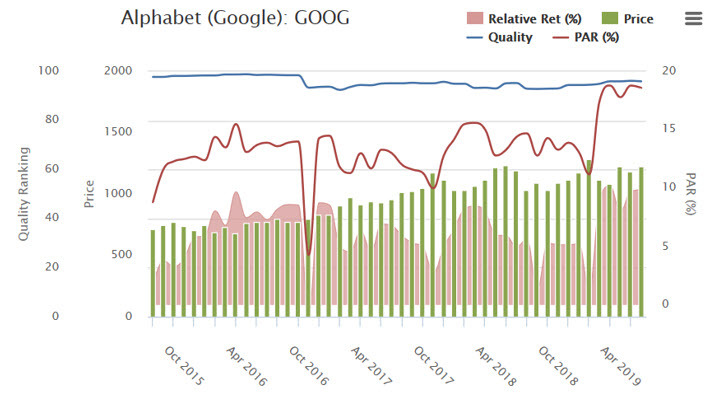
Google: Chronicle. The return forecast (PAR, red line) was at 4-year high levels at the time of the October Investing Round Table. Ken Kavula often features companies trading near long-term peaks in their projected annual returns.

Mark Robertson
Mark Robertson is founder and managing partner of Manifest Investing, a source for research and portfolio management focusing on strategic long term investors.