AdvisorShares Focused Equity (CWS)
Funds & Featured Portfolios, by Mark Robertson, Managing Partner September 28th, 2017
After beating the S&P 500 in 8 of the last 10 years, it looks like a photo finish for 2017 for Eddy Elfenbein and his Buy List-based ETF as the 4th quarter of 2017 unfolds.
Fund Feature (September 2017)
AdvisorShares Focused Equity (CWS)
by Mark Robertson
One of our favorite things to do is to find successful investors who seem to think like us. We have featured Eddy Elfenbein of www.crossingwallstreet.com several times because by all indications, he seeks the same qualities and potential in stocks that we do. His “Buy List” of 20 stocks have been purchased on New Year’s Day and HELD for the year for a little more than a decade. Over the course of that experience, Eddy has beaten the S&P 500 in 8 out of the last 10 years. This is fairly rare company.
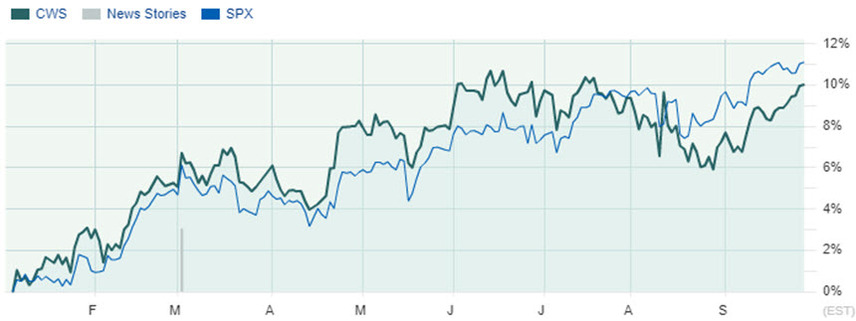
Eddy’s Buy List (CWS) vs. S&P 500. Elfenbein has beaten the S&P 500 in 8-of-the-last-10 years. Through 3 quarters of 2017 with his Buy List-based fund, it’s a dead heat and he (and we) will be hoping for a solid fourth quarter.
Late last year, Eddy started an exchange traded fund based on the Buy List and upped the number of stocks to (25). The top twenty (by % of assets) are shown in the accompanying fund dashboard.
So he beats the market … and he thinks like us. Yes, he’s included Cognizant Technology (CTSH) for a long time. Bard and Stryker have been favorites for a long time as well as Sherwin-Williams, AFLAC and Danaher.
So we naturally are interested in any potential stock ideas that surface, particularly the smaller undiscovered companies. We’d like to see Eddy bump up the overall growth rate with a few more smaller companies but it’s hard to argue with success. The overall quality is excellent and the PAR is slightly greater than the market average (approximately 6%) due to the solid YTD performance of companies like HEICO (up 47.5%) and Cerner (up 50.0%). Others have lagged such as new Tin Cup component and September Round Table selection Alliance Data Systems (ADS). We should audit Continental Building (CBPX) and see if any other new names materialize and align alongside this collection of community favorites.
We’ll be following along as Eddy goes shopping for the 2018 Buy List around Christmas time and cheering the portfolio on as CWS comes to the finish line versus the S&P 500.

Eddy Elfenbein and Crossing Wall Street. The portfolio is chock full of community favorites and Eddy’s weekly blog updates are highly recommended reading for all serious investors and stock watchers.

Mark Robertson
Mark Robertson is founder and managing partner of Manifest Investing, a source for research and portfolio management focusing on strategic long term investors.