Excursions of Exuberance
Cover Story, by Mark Robertson, Managing Partner November 1st, 2013
Our community of like-minded long term investors can be a wealth of guidance. The lessons over the decades are strong and sometimes we all have to be reminded to listen to our own instincts and advice.

Monthly Round Table Webcast Join Ken Kavula, Cy Lynch, Hugh McManus and Mark Robertson for our November Round Table on Saturday, November 23 at 11 AM ET. Our knights of the round table share favorite study stocks and tackle challenges with a tracking portfolio … for more information, check: http://www.manifestinvesting.com/events or ask nkavula1@comcast.net to add you to an email friendly reminder list.
While on the road with Ken Kavula and passing the highway miles, Ken and I will routinely solve any number of world challenges. The problem is that we never record or write them down and neither of us can remember where we put the Gingko Biloba bottle … That said, during our recent visit with like-minded investors in Chicago, we talked about some powerful lessons learned. It had to do with the Forbes Best Small Company list for 2013 (featured in this issue) and the performance — make that dismal underperformance — of some of the stocks from 2009-2010. As it turns out, many of the answers lie in plain view at the heart of industry studies … and we’re reminded to seek the Best-of-the-Best with eyes wide open.
“An investment in knowledge always pays the best interest.”
— Benjamin Franklin
We wonder what Ben would have thought of an investment in any number of educational services stocks over the last several years.
We know some of the best short sellers, like Jim Chanos, have been trumpeting a dirge and profiting for years when it comes to the industry. Companies like Apollo Group (APOL), Capella (CPLA), DeVry (DV) and Strayer Education (STRA) have been among community favorites for years. Strayer appeared on the Forbes Best Small Companies for 2008, 2009 and 2010. Capella appeared in 2009 and 2010. American Public Education (APEI) was featured in 2010 and 2011 and has actually fared relatively well.
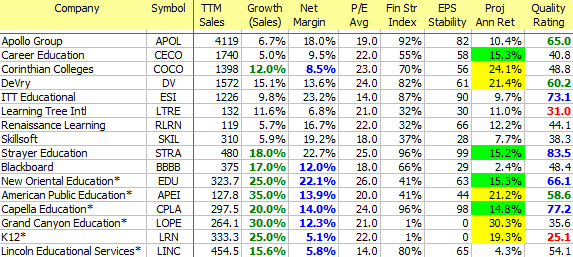
Education Services: 4th Quarter 2009. The average growth forecast was 15.4% with an average projected net margin of 14%. The overall projected average P/E was 21×. The average PAR for the group was 14.1% and a number of companies resided in the excellent and good quality quintiles. What could possibly go wrong?
Close your eyes and think back to late 2009. Stock prices had been recovering since March and the median Value Line low total return forecast was back to 8%. The median return forecast for Education Services was 16% and our projected annual returns were 14.1%. The average price-to-fair value ratio for the Education Services stocks was 77% at Morningstar … and 105% at S&P. Forbes was extolling the virtues of these educational track records (good growth and profitability).Value Line had a very bullish outlook and was joined by Morningstar with an echo heard by many of our fellow investors, including me.
I think we can dub this condition an excursion of exuberance going forward …
So… Everybody Wins?
Our community of like-minded long term investors can be a wealth of guidance. The lessons over the decades are strong and sometimes we all have to be reminded to listen to our own instincts and advice.
In this case, I’m reminded of a couple of things.

Education Services (4th Quarter 2009). At the time, actual revenues for 2009 were on an excursion. A historical growth trend of 8.5% was magically transformed into 15.5%, on average.
1. A few years ago, while serving as a volunteer for NAIC in Chicago, I was invited to visit an investment club. The name of the club was “Sisters of the Street.” (Not kidding) My imagination ran wild. I called my colleague Judy Shutters and asked if she wanted to help me out. (There was a possibility that plausible deniability could be important …) Judy and I pulled up at a vaguely familiar address in Wheaton, Illinois to discover a convent and a group of nuns! As we reviewed their stock studies and discussed a variety of things, our attention was drawn to a study of youthful Starbucks and a growth forecast of 45% straight off the business model analysis.
Judy and I counseled the sisters that while this could be feasible, if it came to pass — Starbucks would be three times the size of Coca-Cola in a short number of years. Heads nodded and some tempering and conditioning ensued …
2. Ken Kavula reminds me of something I said back in the late 1990s. It had to do with the entire group of companies in office supplies. At the time, the return forecasts for Office Depot, OfficeMax, Staples and thirteen companies that no longer exist were stratospheric. The point was that they all can’t win, particularly when we’re talking about direct competitors. Fast forward a decade or so and one could argue that none of them has prevailed (yet).

Education Services: Industry Growth Characteristic. Revenues vs. Growth for the industry, displaying the maturity curve as a function of life cycle growth. Successful companies get bigger and slow down.
A For-Profit School On Every Corner
Pendulums are reliable. The distance covered from side to side is pretty steady, until somebody involves a booster rocket or braking parachute. We’ve cited the popularity of bowling in the 1950s and the explosive success of Brunswick at the time. The harsh reality was that for this trend to persist, we’d have needed a bowling alley on every corner and every American would have owned multiple bowling balls.
The longer-term growth trend for Education Services, in aggregate, was 8.5% back in the years leading up to 2008. We now know that 2009 was artificially exploded by a number of things (some of them, legal.) A historical growth rate for the companies shown in the industry listing suddenly achieved escape velocity and the average for the industry group surged to 15.5%. In 2008-2009, the number of students enrolled at universities outnumbered the for-profit enrollees 10:1. In order for that trend to sustain, the number of students at for-profit institutions would outnumber the total number of students at colleges and universities by something like 2020. Flashing back to luxury coffee, Coca-Cola and room full of nuns … the feasibility of our assumptions starts to melt. And all of this is before Senator Harkin, and his batmobile braking parachute, started “following the money.”
Growth characteristics are industry specific. It makes sense to include an awareness of growth trends as shown in accompanying figure as part of any stock study.
With 20/20 hindsight, we’re basically looking back for lessons to be learned. Much of this was initiated by a pretty simple analysis of the Forbes Best Small Company selections over the years. We’ve been featuring these annual listings for years and the results are compelling — a relative return of +2.9% since 2006.
That 2.9% climbs to approximately +5.0% if we could have avoided educational services stocks like Strayer and Capella — essentially avoiding a few of the weaker performers in the multi-year Forbes small company roll call.
From Excursions To Expectations

Best of Forbes Best Small (2006-2013). The annualized relative returns (since selection) for the entrants in our annual dashboards. Any entry >0% (right side of chart) has outperformed the general stock market since selection. The appearance frequency of STRA and CPLA on the left hand side of the chart is what inspired some soul-searching and head scratching. Where’s the Rule of Five?

MANIFEST 40 (2005-Present). The Rule-of-5 suggests that 60% of your actual results will resemble your study projections. 20% will underperform (left side) and 20% will outperform (right side). There’s a bit of a bell curve forming in the middle with the most widely-followed companies by our community. Note the positions of core holdings like ABT, AFL, JNJ, PEP, PG and CVS near the middle and the smiles delivered on the right by CTSH, PRAA, BWLD and AAPL.
David L. Babson is credited with the concept of the Rule-of-5 (actually Rule-of-10 in the original incarnation) that suggests a bell curve distribution of actual results versus stock study forecasts over time. Babson actually had two bells … our familiar 20%/60%/20% for core holdings and another, more skewed, distribution for non-core stocks, companies that Jeremy Grantham might refer to as “flaky.”
I think we see this in the Forbes Best Small Company results over the years as the bell curve turns upside down with more successes (right side) and failures (leftside) in the collection of results. This makes sense. We talk about giving less leash to non-core and smaller companies and suggests that they require more vigilance and less patience on the selling trigger. As shown here for the MANIFEST 40, the distribution is closer to what we’d expect … and we’re grateful for that flock of companies favoring the right side (outperforming the market) over the last 7-8 years.
Recognize that growth is a function of life cycle and industry. Use our industry snapshots and focus industry studies on prudent comparisons between companies and industry-specific characteristics like growth. Be vigilant for excursions fueled by exuberance. It’s unlikely that many of us want to stack bowling balls in the closet or attend for-profit classes 28 hours/day, 8 days a week … in order for our forecasts to be achievable. And most of all, focus on the greatest challenges facing the companies you study/own and challenge the sustainability of growth and quality.

Mark Robertson
Mark Robertson is founder and managing partner of Manifest Investing, a source for research and portfolio management focusing on strategic long term investors.