Enough Mayans, Back to Nostradamus
Cover Story, by Mark Robertson, Managing Partner January 1st, 2013
Welcome 2013. Again, a new year. It’s also that time of year when we reflect in two directions. It’s hard to look forward without looking backward.
Welcome 2013. Again, a new year. It’s also that time of year when we reflect in two directions. It’s hard to look forward without looking backward. Our expectations are products of experience. Our predictive models are actually pretty simple, the sort of tools that would likely have made Ben Graham relatively comfortable. “If the math involves more than algebra … it’s probably not of much utility in the realm of investment analysis.” As we look forward, we celebrate successful models (like Crossing Wall Street.) And multitudes of others who believe in a method with over seven time-honored decades.

Crossing Wall Street by Eddy Elfenbein. Leading blogger Eddy Elfenbein has made his 20 stock selections for 2013 a la his superb blog at www.crossingwallstreet.com So what? Why should we care? (1) He thinks like you do. (2) Use his selections as a shopping list for study candidates. It’s highly possible that you’ll discover that something is in it for you. (3) If you’re a shareholder or stockwatcher for any of the featured stocks, we think his regular commentaries will serve you well. Congratulations, Eddy, on six straight years of topping the S&P 500. We really believe we’re in this together and we’ll continue to hope for the best going forward for all of us. Happy New Year!
“In a pyramid near the middle of the New World”
“Work will stop on a calendar in the 12th month of the 21st century.”
“Celebrating the Solstice, the architect of days will fiesta.”
“Agave juice turns fiestas into siestas and future generations will roil.”
OK, Nostradamus didn’t write that. But he could have. In fact, it could be among some long-lost and yet-to-be-discovered piles of parchment, filed under “Da Vinci Code and Related Stories.”
It’s a new year. The Mayans were wrong. Or we misunderstood them. Or they may have been “early?”
Pressing On
And it’s time for throngs of fearless forecasters to step up and deliver their prognostications for 2013 and beyond. Don’t miss “The 12 Best Stocks to Own for 2013,” and “10 Scorching Funds Who Will Stay Blazing During 2013.” Uh huh. At the same time, we’re reminded that it makes sense to blend a little nostalgia and history as we try to come to grips with the best resources to yield some of our attention.
Some crystal balls are better than others and some practitioners are clearly more likely to be descendants of Nostradamus. As many of you know, we’ve recently celebrated the achievements of one Eddy Elfenbein. Why? Because he stands out. And he stands alone. How so? Not a single stock fund has beaten the S&P 500 index for the last six years. None. Nada. Zilch. But Eddy has.
At his blog, Eddy selects (20) stocks on December 31 and doesn’t touch them until changing calendars. His Buy List has now outperformed the S&P 500 for 6-out-of-7 years, including the last six in a row. You can find a public dashboard of his (20) selections for 2013 at: http://www.manifestinvesting.com/dashboards/public/crossing-wall-street-2013
Stroll down the list. Eddy obviously shops in the same aisle that we do. With annual turnover of five stocks (25%), he also shops with the same levels of frequency.
Value Line: Overall Market Perspective
For an outlook that is a little bigger picture, but still harbors Nostradamusesque qualities, we turn to one of our favorite indicators, the Value Line low total return forecast courtesy of the Value Line Investment Survey. It’s something that I’ve tracked for a few years — but decided to take a closer look.
Looking back, this low total return forecast indicator has been correct (within range) for four of the last six years. The average forecast during that period has been 12.7% and the actual annual market return has been 10.5%. For 2012, the forecast was 10.4% and the actual result came in at 17.4% for the Value Line Arithmetic Average (^VAY) of 1700 equally-weighted stocks. Here’s a closer look at how the 2012 forecast was formed. It’s basically a compilation of the 4-year, 3-year, 2-year and 1-year forecasts based on the annual ending values. The projections are built by taking the low total return forecast at the time (12/31/2011, 12/31/2010, 12/31/2009 and 12/31/2008) and building an aggregate forecast from all four points in time. Here are the components of the 2012 forecast:

The forecast value for ^VAY was 2975.12. The actual year-end close was 3164.70, achieving slightly better results than forecast, but in range. What range? Based on the four forecasts, the low forecast ranged from 0.7% to a high of 24.2%.

Annual Stock Market Returns (1941-Present). We start with 1941 because it is post-SEC and post-Investment Company Act, essentially the start of the modern stock market. The graphic displays the results of individual years ranging from the “special” (unique and virtually unprecedented) performance we experienced in 2008 with its -37% total return … up to the returns witnessed in 1954 and 1958. It’s helpful to remind and be reminded that the results of any given year can pretty much plop anywhere from -20% to +40%. But the middle looks pretty good to us.
The width of the range varies from year to year, but we think it’s important to underscore what is possible (and reasonably expected) — a message that we regularly send with our stack of boxes in the accompanying graphic. And in this case, the 2012 box was expected to “land” where it did.
Here’s a look at the trailing 10-year Value Line low total return-based forecasts. The challenges following 2000-2002 were pretty clear and pretty disruptive. I suspect that as we go back a few more years, we’ll see more green ink and less red.

But the results for the last several years are compelling … and they get even more compelling (at least to me) when we zoom in on 2009. Yes, that’s not a typo. Those 60% returns (forecast and actual) are pretty intriguing. The S&P 500 results are included merely for a frame of reference.
But two things:
1. The forecasts actually come closer to the S&P 500 actuals. Hmmm.
2. We find it intriguing that the average error for all of the 4-year forecasts is actually LOWER than the 1-year forecasts. The intuitively more challenging long-term forecasts were more accurate than the short time horizon — at least for this set of results. Double-hmmm (and more on that in the future).
As we noted at the time during late 2008 and 2009, this wasn’t a “back up the truck” moment … this was a “how many trucks have you got?” moment. Hugh McManus and I were recently discussing these results and the sticking out like an opposable sore thumb moment that was 2009. Were we assertive enough? We counseled high-quality going into the Great Recession and that served us well. Did we nudge enough in the realm of special situations? I don’t know. But I do think it’s worth a look back at 2008: A Dark Night for any newcomers to Manifest Investing … and revisiting that moment in time is probably a good idea for all of us.
… And The 2013 Cat Is Out Of The Bag
Using this approach, the 2013 forecast is for a total return of 6.3% when 12/31/2013 arrives.
The forecasts range from a low of -4% to a high of 13%. What impact does this have on our expectations and/or behavior?
First of all, not much. Continue seeking high-quality companies and be selective — make sure that the return forecast justifies your interest. If anything, ratchet up your minimums for quality and financial strength when screening. With MIPAR at 7-8%, we’re hovering near levels of “fair market value.” Any surges to the upside in price or avalanche of earnings disappointments could lead to a significant correction in the stock market. If you’re preserving capital and deploying a balanced strategy — heed the cash equivalent suggestions from Value Line’s asset allocation and monitor our Balanced demonstration portfolio (it’s currently at 40% “cash.”)
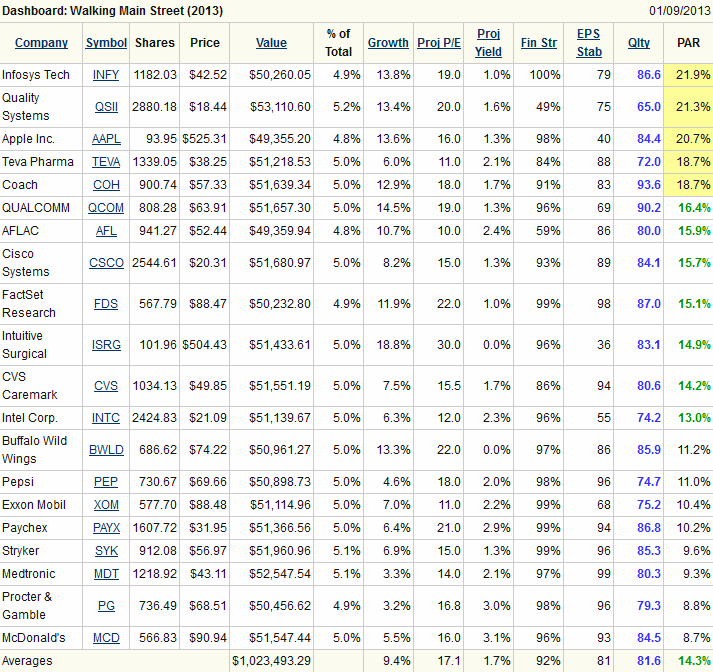
Walking Main Street (2013). This list of (20) stocks was selected from the MANIFEST 40 most widely-followed stocks. Selection was based on a combination of return forecast (PAR), quality and momentum/sentiment. We hope these 20 stocks will fare well and keep up with Eddy’s Buy List at Crossing Wall Street. The public dashboard is available at: http://www.manifestinvesting.com/dashboards/public/walking-main-street
Walking Main Street
We’ll be playing along with Eddy and Crossing Wall Street for 2013 with our own crop of favorites from the MANIFEST 40 and our own Christmas Countdown. For more on this, see Walking Main Street.
Move over Mayans. We’ll be back next month with Punxsy Phil, our peerless prognosticator.

Mark Robertson
Mark Robertson is founder and managing partner of Manifest Investing, a source for research and portfolio management focusing on strategic long term investors.