In Search of the Best Stocks
Clubhouse, by Ken Kavula, Subscriber October 1st, 2015
The Manifest Investing site has a number of jumping off points that would help investors who are creating their first portfolio. We would suggest starting with the stock screener to get some ideas.

The Clubhouse is for sharing features and tips & tricks … If you’re new to Manifest Investing, starting out will vary depending on your own personal situation. In my August 2015 column, I discussed how a person new to the website who owns his or her own portfolio of stocks and mutual funds might begin using the Manifest Investing site. This month, I’ll talk about using the MI site if you’re an individual investor just beginning to create your first portfolio. In the future we’ll look at people with no personal portfolios who belong to an investment club and people completely new to the world of stock investing. Let’s get started!
The Manifest Investing site has a number of jumping off points that would help investors who are creating their first portfolio. I would suggest starting with the stock screener to get some ideas. It’s listed under the tab Stocksearch at the top of the homepage.
This simple search tool will help you create a list of interesting stocks that you might want to consider for purchase. Before using the screener, however, it’s important to understand a few simple terms. Everything that Manifest does comes back to Quality and PAR. PAR stand for Potential Average Return and it’s based on a simple model using aggregated numbers from a group of different sources. Previous clubhouse columns have discussed how to calculate PAR and I urge you to reference them as you look for great stocks.
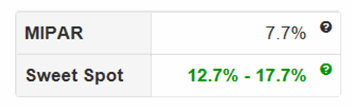
Once we have a PAR value for a particular stock we compare it to the overall market PAR value for an average stock in our database. That value is labeled MIPAR for Manifest Investing Potential Average Return and is always located on the front page of the website.

Over history, PAR has averaged around 10% so can see that the current value of under 8% is indicating a market where stocks are a little overvalued. Our goal in creating a portfolio is to beat the current market by 5 to 10 percentage points. The calculation of this “sweet spot” is very simple and results in values, based on a 7.7% PAR, between 12.7% and 17.7%. Stocks with PAR vales in excess of 17.7% might be in the “too good to be true” range and would require extra study and thought.
Clicking the Stocksearch button and selecting New Stocksearch gives the accompanying input screen.
For someone just beginning to create a portfolio, I would recommend that a single line be filled in on the screener. Ignore everything else on the form and proceed to the line labeled Manifest Rank. It’s near the bottom of the tool. This rank is a listing that ranks all of the stocks in the database from best to worst based on a calculation that takes into consideration the stock’s Quality and its current PAR value. In other words, the list attempts to point out the best stocks for purchase at a particular moment. I use the number 99 in the first box and leave the second box empty. That tells the computer I’d like to see all of the stocks in the 99th percentile and above.
Here’s the list that was generated (October 28, 2015):

Screen For The Best!
Not all of these stocks are appropriate investments for all portfolios. Some of them have some flaws which might make you uneasy. I do think, however, that this list can give you 5-10 great ideas for future study and eventual investment. I certainly think that any new investor would recognize many of the companies on this list.
Once you’ve settled on an interesting idea, your next step is to examine the page devoted to that particular stock. I’ve chosen Cognizant Technology from the list and clicked on its ticker. The accompanying company report appears.

It’s called an Equity Analysis Guide and referred to as an EAGLE. You see first of all that CTSH has the highest quality rating that can be awarded (100). Down near the bottom of the grid, you see the four components that make up the rating and you also see the raw score for CTSH (90.4). Twenty-five points can be awarded in each category. An award of 12.5 points means the company is doing as well as the entire industry. Higher numbers indicate outperformance compared to the industry. Looking at profit margin, for example, we can see the industry average is 10.3%. Checking the profit margin for CTSH (boxed in red) you can see it is 14% and earns a higher than average rating in the quality calculation.
There’s more to look at on this page and I urge you to do so. Next month, we’ll use the Forum to drill deeper on a specific company — providing the type of information you need to know as you practice stewardship as an individual investor and/or investment club partner. Meanwhile, if any of you have questions or issues you’d like explained, don’t hesitate to drop me a note at kkavula1@comcast.net.

Ken Kavula
Ken Kavula is a retired educator and successful long-term investor. Ken has served in a number of leadership positions for the National Association of Investors and is active in four investment clubs. Welcome to the Clubhouse. Subscribers are invited to share their favorite experiences, suggest best practices and most importantly, let us know “What’s on your mind?” What topics and questions do you have? We all get better when we do this together. Email Ken at kkavula1@comcast.net.