Reading a Company Page
# Reading a Company Page
A company page centralizes all key investment data in one place, helping you quickly evaluate whether a stock meets your investment criteria.
## What you'll accomplish
By the end of this guide, you'll know exactly where to look on a company page to make informed investment decisions and identify stocks worth deeper analysis.
## Page Layout
The company page has two main tabs:
- **Overview**: Key metrics, price chart, and comparative analysis
- **Research**: Detailed analysis and historical data
## Step-by-step instructions
### 1. Check Quality (top priority)
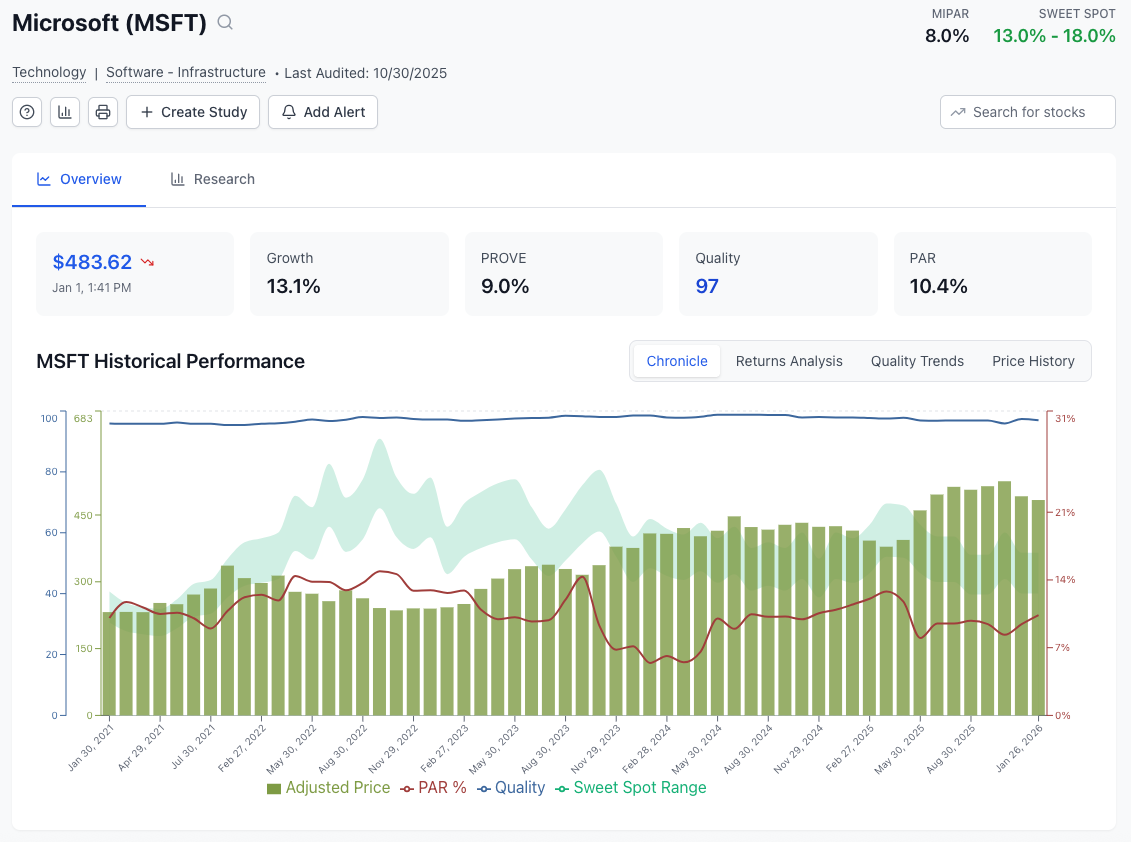
The Quality score appears in the key metrics area. This 0-100 percentile ranking tells you how this company compares to all others we track:
- **80+ (Blue, Bold)**: Excellent — top 20% of companies
- **60-80 (Green)**: Good — worth consideration
- **Below 60**: Proceed with caution or skip entirely
**Action**: If Quality is below 60, consider moving to the next company unless you have specific reasons to investigate further.
### 2. Check PAR vs. MIPAR
Look for the Projected Annual Return (PAR) and compare it to MIPAR shown in the header:
- **PAR in Sweet Spot (MIPAR+5% to MIPAR+10%)**: Ideal buying opportunity (shown in green)
- **PAR above Sweet Spot (>MIPAR+10%)**: Investigate carefully; may signal risk (shown in yellow)
- **PAR below MIPAR**: Below-market returns expected, generally avoid
### 3. Review the key metrics
The Overview tab shows essential metrics at a glance:
| Metric | What to Look For |
|--------|------------------|
| **Current Price** | Recent price with daily change |
| **Growth Forecast** | Projected sales growth rate |
| **PROVE** | Projected return on value |
| **Quality** | Percentile ranking (0-100) |
| **PAR** | Projected Annual Return |
### 4. Check RSI (momentum indicator)
The RSI (Relative Strength Index) helps identify entry timing:
- **High RSI (70+)**: Stock may be overbought, consider waiting
- **Low RSI (30-)**: Potentially oversold, could be good entry point
- **Moderate RSI (30-70)**: Neutral timing
### 5. Explore the metrics grid
Scroll down to see detailed financial metrics:
- Financial Strength rating
- P/E Ratio and Price-to-Sales
- Return on Equity (ROE)
- Debt-to-Equity ratio
- Dividend Yield
- And more...
### 6. Compare to peers
The bottom of the Overview tab shows:
- **Top companies in same sector** by quality ranking
- **Top companies in same industry** by quality ranking
This helps you see how this company stacks up against similar businesses.
## Tips for success
**Start with Quality and PAR**: These two metrics alone can eliminate 70% of unsuitable investments.
**Use color coding**: Blue Quality = excellent, Green PAR = Sweet Spot. The colors guide you.
**Compare within industries**: A PAR of 12% might be excellent for utilities but modest for technology stocks.
**Watch for red flags**: Declining revenues, excessive debt, or inconsistent earnings should prompt additional investigation.
## Next steps
- [Understanding Quality Ratings](/guide/core-concepts/quality-rating) - Deep dive into quality scores
- [PAR and Sweet Spot Strategy](/guide/core-concepts/sweet-spot) - Master the buying strategy
- [Building Your First Dashboard](/guide/getting-started/first-dashboard) - Track your research
- [Stock Screening](/guide/using-the-platform/stock-search) - Find more candidates