Your First Dashboard
# Your First Dashboard
Dashboards transform how you see your portfolio by focusing on the key metrics that drive investment success: PAR, quality, and diversification.
## What You'll Accomplish
After creating your first dashboard, you'll understand:
- Your portfolio's projected annual return compared to market expectations
- The overall quality of your holdings
- How well diversified your portfolio is by sector and growth rate
## Step-by-Step Instructions
### Step 1: Create Your Dashboard with Holdings
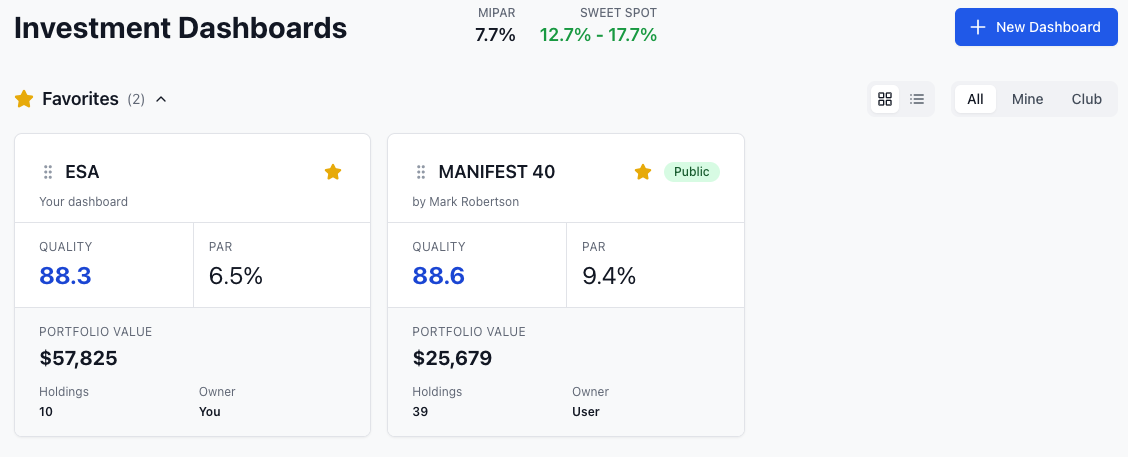
1. Click **Dashboards** in the main navigation
2. Click the **New Dashboard** button (top-right of the page)
3. Enter a name for your dashboard (e.g., "My Portfolio" or "Retirement Account")
4. Optionally add a description and starting cash amount
5. Scroll down to the **Holdings** section
6. Type a stock symbol (e.g., AAPL), then press Tab to move to the shares field
7. Enter the number of shares you own, then press Tab or Enter to add another row
8. Repeat for each stock in your portfolio
9. Click **Create Dashboard** to save everything
**Tip**: You can add stocks with zero shares to create a watchlist within your dashboard. The form validates symbols as you type and shows company names for confirmation.
### Step 2: Review Your Dashboard Metrics
Your dashboard header displays key portfolio metrics:
| Metric | What It Shows | Good Range |
|--------|---------------|------------|
| **Portfolio PAR** | Expected 5-year annual return | MIPAR+5% to MIPAR+10% |
| **Quality** | Weighted average quality score | 65+ (Good to Excellent) |
| **Growth** | Expected sales growth rate | 10-14% for balanced portfolios |
| **Total Value** | Current market value of holdings | Your investment amount |
The MIPAR indicator shows the current market baseline and Sweet Spot range for quick comparison.
### Step 3: Explore the Diversification Charts
Scroll down or click the charts toggle to see two diversification views:
**Sector Diversification**: Shows how your portfolio is spread across market sectors (Technology, Healthcare, etc.). Aim to avoid over-concentration in any single sector.
**Size Diversification**: Shows the mix of growth rates in your portfolio:
- **Faster Growth**: Companies with 12%+ projected sales growth
- **Medium Growth**: Companies with 7-12% growth
- **Slower Growth**: Companies with less than 7% growth
### Step 4: Customize Your View
Click the **Actions** menu to customize your dashboard:
- **Columns**: Choose which data columns to display
- **Table Density**: Adjust row spacing (compact, comfortable, or spacious)
- **Hide Values**: Toggle privacy mode to hide dollar amounts
- **Export**: Download your holdings as CSV or Excel
## Tips for Success
**Start Simple**: Add 3-5 core holdings first rather than your entire portfolio. This makes patterns easier to spot.
**Focus on the Big Picture**: Don't get caught up in individual stock details. The dashboard shows portfolio-level insights that individual stock analysis can't provide.
**Ask Key Questions**:
- Is my projected return sufficient for my time horizon?
- Do I own too many average or poor quality companies?
- What does my portfolio need most: higher returns, better quality, or more growth?
**Star Your Favorites**: Click the star icon to mark frequently-used dashboards as favorites for quick access.
## What Your Dashboard Tells You
### If Your Portfolio PAR is Below MIPAR
Your portfolio may underperform the market. Consider replacing lower-PAR holdings with stocks in the Sweet Spot range.
### If Most Holdings Rate Below 65 Quality
Focus on upgrading to higher-quality companies. Poor quality stocks often disappoint even when they look attractively priced.
### If One Sector Dominates
Your diversification charts will highlight concentration risk. Consider adding holdings in underrepresented sectors.
## Learn More
- **Learn the metrics**: Read [Understanding PAR](/guide/core-concepts/par) and [Quality Ratings Explained](/guide/core-concepts/quality-rating)
- **Find better holdings**: Use [Stock Screening](/guide/using-the-platform/stock-search) to identify Sweet Spot candidates
- **Deep dive on dashboards**: See [Dashboard Features](/guide/using-the-platform/dashboards) for advanced options
- **Set up alerts**: Create [Alerts](/guide/using-the-platform/alerts) to monitor when holdings move out of target ranges
Remember: The goal isn't perfection—it's continuous improvement. Your dashboard shows you exactly where to focus your efforts for maximum portfolio impact.