PAR (Projected Annual Return)
# PAR (Projected Annual Return)
PAR is your expected annual return over the next 5 years, combining price appreciation and projected dividend yield.
## Key Points
- **PAR = Price Appreciation + Dividend Yield** (always 5-year outlook)
- **Higher PAR = Better buying opportunity**
- **PAR fluctuates with stock prices** - creating buying/selling signals
- **Compare to [MIPAR](/guide/core-concepts/mipar)** to gauge relative attractiveness
## The Basics
PAR answers the fundamental question: "What return can I expect if I buy this stock today and hold it for five years?" It combines two components:
1. **Price Appreciation**: The annualized gain from current price to projected price in 5 years
2. **Dividend Yield**: Expected annual dividend payments as a percentage of current price
The projected price calculation considers current sales, sales growth forecasts, projected profit margins, outstanding shares, and historical price-to-earnings ratios. This forward-looking approach helps you make decisions based on what's likely to happen, not what already occurred.
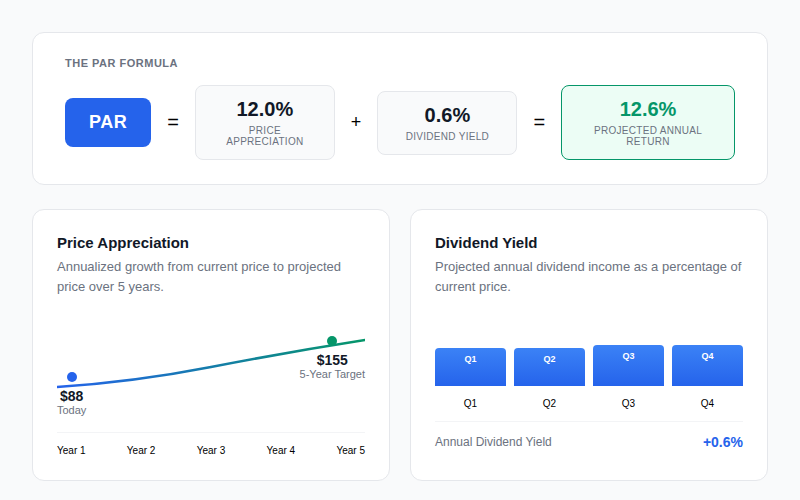
PAR increases in two ways: company fundamentals improve (better growth or profitability expectations) or the stock price drops while fundamentals remain steady. This creates the opportunities investors seek: high-quality companies temporarily trading at attractive prices.
## On the Platform
PAR appears throughout Manifest Investing:
- **Stock cards**: Shows current PAR with color coding
- **Watchlists**: Sort by PAR to identify top opportunities
- **Portfolio dashboards**: Track PAR changes over time
- **Sweet Spot alerts**: Notifications when PAR enters the [Sweet Spot](/guide/core-concepts/sweet-spot) range
Use PAR to:
- **Identify buying opportunities**: Look for PAR spikes above [MIPAR](/guide/core-concepts/mipar)
- **Evaluate selling decisions**: Consider selling when PAR drops significantly
- **Compare investments**: Higher PAR generally indicates better opportunity
| PAR Range | What It Means | Action |
|-----------|---------------|--------|
| Above MIPAR+10% | Potentially unrealistic projections | Investigate; may signal risk |
| MIPAR+5% to +10% | **Sweet Spot** | Ideal buying range |
| MIPAR to +5% | Modest upside | Acceptable but not compelling |
| Below MIPAR | Below-market returns expected | Generally avoid |
## Learn More
- Learn about [Quality Rating](/guide/core-concepts/quality-rating) - the other essential metric
- Understand [MIPAR](/guide/core-concepts/mipar) for market context
- Explore the [Sweet Spot](/guide/core-concepts/sweet-spot) buying strategy
- Read [Purpose-Driven Investing](/articles/purpose-driven-investing) for PAR philosophy