MIPAR (The Market Baseline)
# MIPAR (The Market Baseline)
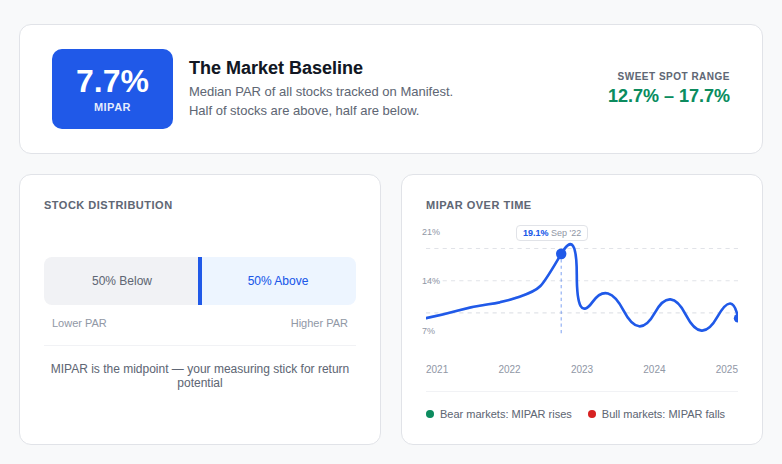
MIPAR is the median [PAR](/guide/core-concepts/par) of all stocks tracked on the Manifest platform, your benchmark for "average" market returns.
## Key Points
- **MIPAR = Market baseline**: The median PAR of all tracked stocks
- **Above MIPAR = Above-average returns**: Look for stocks with PAR > MIPAR
- **Sweet Spot range**: MIPAR+5% to MIPAR+10% is the ideal buying zone
- **Changes over time**: MIPAR shifts as market conditions change
## The Basics
MIPAR stands for "Median PAR" and represents the middle point of all [Projected Annual Returns](/guide/core-concepts/par) across our tracked universe of stocks. Half of all stocks have PARs above MIPAR, and half have PARs below it.
Think of MIPAR as your measuring stick. If a stock has a PAR of 12% and MIPAR is currently 10%, that stock offers above-average return potential. If another stock has a PAR of 8%, it's offering below-average returns compared to the market.
MIPAR isn't static; it changes as market conditions shift. During bear markets, MIPAR typically rises as stock prices fall and return potential increases. During bull markets, MIPAR often falls as prices rise and expected returns decrease.
## On the Platform
You'll see MIPAR displayed prominently in several locations:
- **Stock Grader**: Shows how each stock's PAR compares to MIPAR
- **Dashboards**: Displays MIPAR alongside your portfolio's average PAR
- **Stock listings**: Color-coded to show stocks above/below MIPAR
- **Sweet Spot indicators**: Highlights stocks in the MIPAR+5% to MIPAR+10% range
The platform updates MIPAR regularly based on the latest data from our tracked universe of stocks.
### Using MIPAR for Investment Decisions
| PAR vs MIPAR | What It Means | Action |
|--------------|---------------|--------|
| PAR > MIPAR+10% | Potentially unrealistic projections | Investigate thoroughly; high PAR may signal risk |
| PAR = MIPAR+5% to +10% | **Sweet Spot** | **Ideal buying zone** |
| PAR = MIPAR to +5% | Slightly above average | Decent opportunity |
| PAR < MIPAR | Below average | Generally avoid |
## Learn More
- Learn about [PAR (Projected Annual Return)](/guide/core-concepts/par)
- Understand the [Sweet Spot buying zone](/guide/core-concepts/sweet-spot)
- See how [Quality Ratings](/guide/core-concepts/quality-rating) work with MIPAR
- Explore [Dashboard features](/guide/using-the-platform/dashboards) for tracking MIPAR